Ever wish you could read minds and understand what users really think about your website or app?
Well… that’s impossible (sorry to get your hopes up), but heatmap and session replay tools come reasonably close.
This article was months in the making. A ton of original research went into it, where I personally used and tested each tool against several criteria, including the effect on page speed, pricing, ML features, ideal use cases, supported devices, integrations, and more. It’s unlike anything else you may find online.
I’m thrilled to present the most comprehensive heatmaps and session recording tools comparison article. Everything you need to know about finding the ideal tool to ace marketing and optimization.
Want to see all the 40 Heatmap tools right now? Jump to the comprehensive review of each tool here.
What Are Heatmaps?
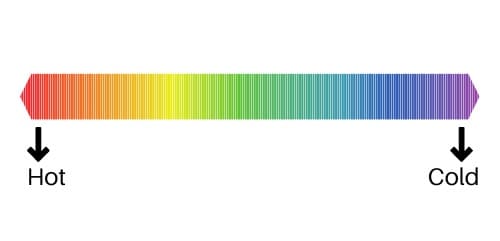
Heatmaps are a way to visualize data values with colors. Typically, higher values are red and lower values are violet.
This interpretation of color intensity across the red-violet spectrum is quite intuitive. At first glance, you can get a sense of what a heatmap represents. There’s more in the red part and less in the violet. It’s called color temperature.
It began in the financial industry in the mid-‘90s. Back then, they were “luminous mosaics of red and blue squares” to help securities traders make buying decisions — because our brains pick colors better than numbers.
In data visualization, it’s used in various ways to quickly grasp the intensity of a data value in comparison with other values. Think of weather maps and population density maps.
In website optimization, heatmaps help you understand how visitors interact with your website. Clicks, scrolling, and hovering can give you a sense of how much they interact with various elements on web pages.
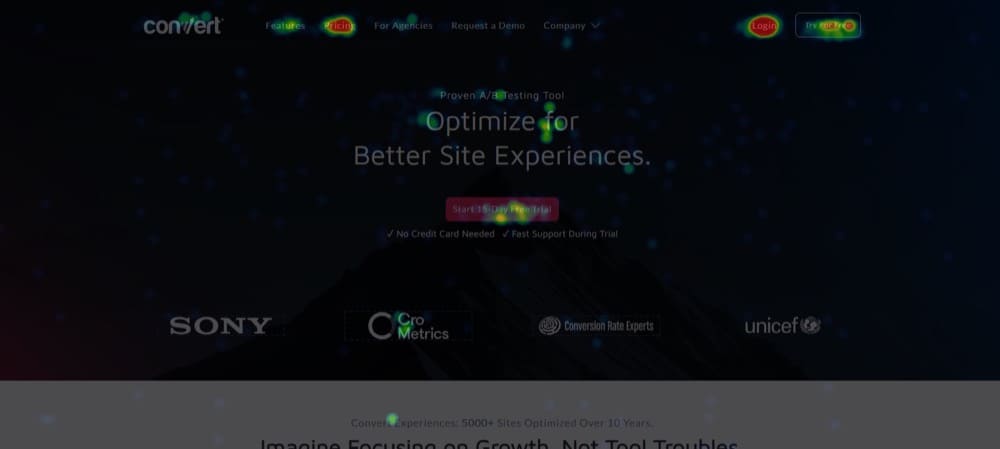
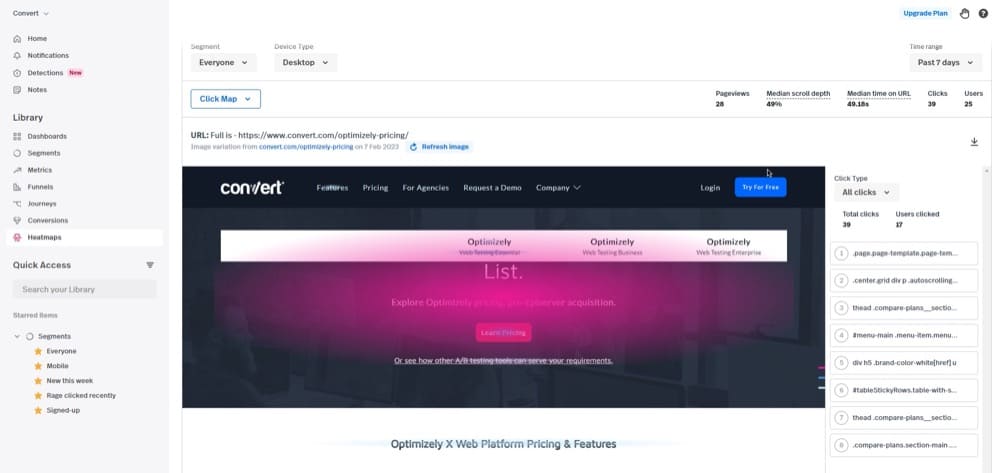
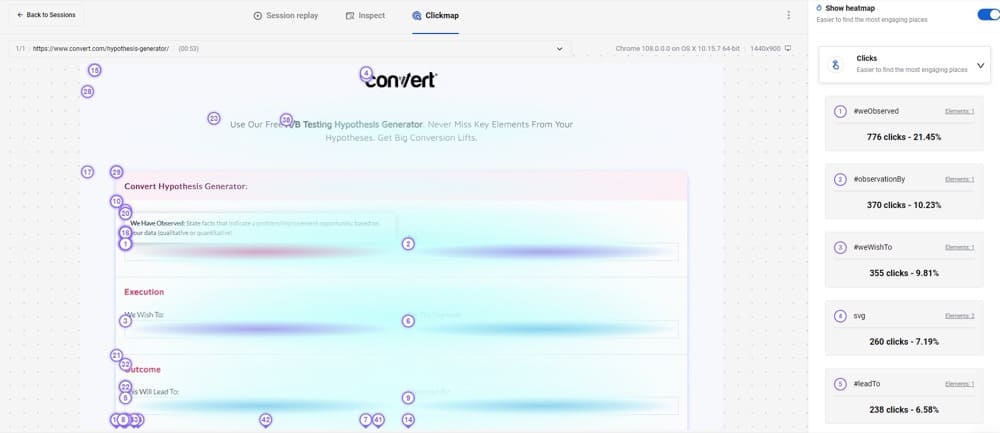
Click maps, for example, look like this:
But that’s only one type of heatmap used in user research. Let’s check out more…
Types of Heatmaps
Heatmapping has been adapted to represent different types of data in a way that makes perfect sense. For example, data on the distribution of clicks on a page shouldn’t be used by itself to determine which parts of a page are most popular.
That’s why proper heatmap tools provide at least 3 of the following types of heat maps (with the first one being the usual number 1):
1. Click Heatmap (Click Map)
Click maps show you where the clicks are happening on your pages. When users click with their mouse or tap on a touch screen device, it adds one value to that point on your page.
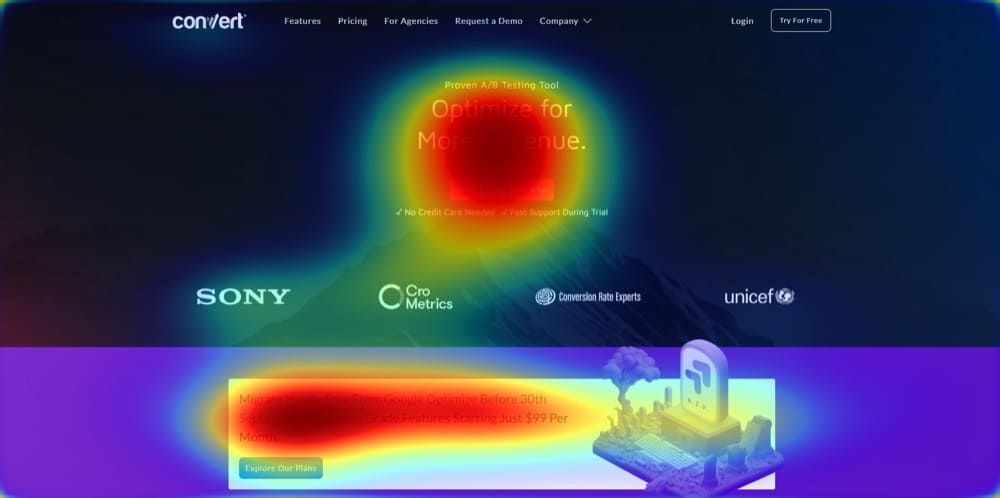
When more clicks and taps hit that specific point, the color moves from violet to green to yellow and the hottest, red.
The click heatmap tells you what elements on your site are getting the most interaction. It also helps you reveal bugs and understand what visitors are most interested in.
2. Scroll Heatmap (Scroll Map)
How far do folks scroll to read the content on your page? Are you losing them at specific points on the page? Google Analytics alone may not provide you with this information (at least not in a visually appealing way), so scroll maps come in handy.
Scroll maps show you how deep visitors reach into your page and help you understand the best place to position crucial info.
If you observe that only 5{1652eb1ffa4184925f6a63a9c04ea6b421acb7a78117241e7d4325cdca8339fa} of your visitors get to the section of your page where you reveal a discount code that helps conversion, you’ll have to move it up to where you get more eyes on it.
3. Hover Heatmap (Hover Map or Move Heatmap)
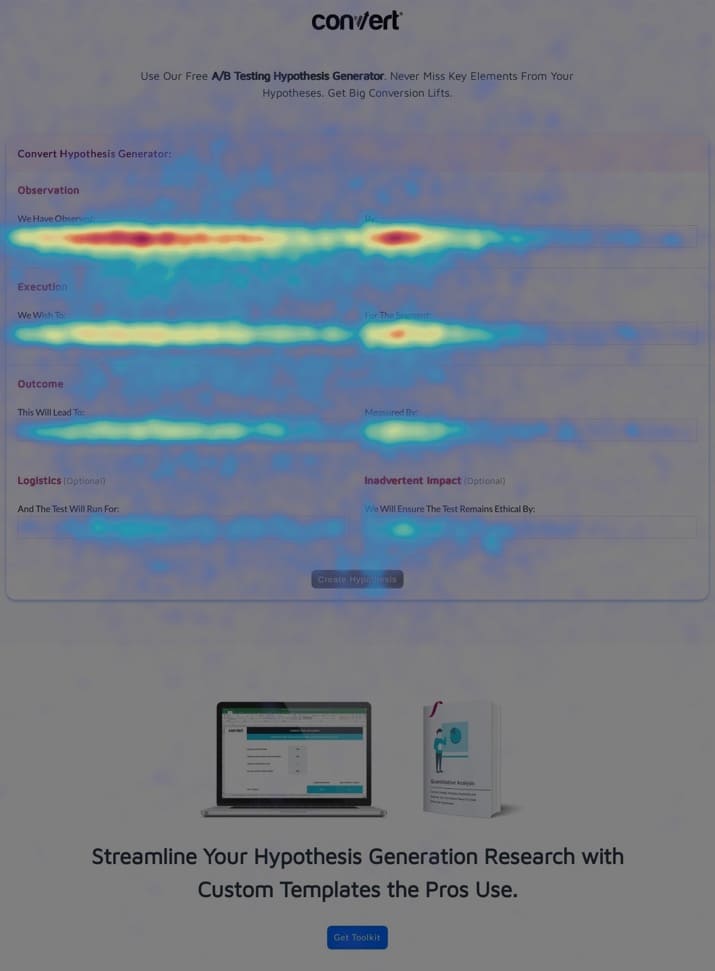
Hover or move maps show you where visitors keep their mouse pointer on the webpage. It tracks the movement of the mouse pointer as an indication of where attention is as people engage with the content on the page.
Some people point their cursor over the elements on the page that they’re paying attention to. For example, I sometimes catch myself highlighting text on the page as I read it to force myself to focus on them during a distraction.
But this isn’t always the case. You don’t want to use any type of heatmap in absence of other data — particularly this one.
4. Attention Heatmap
The attention heatmap divides your page into different parts, elements, and content, and combines interaction data to tell you which part gets the most attention. The interaction data includes the number of clicks, mouse pointer hovers, and visitors scrolling to that point on the page.
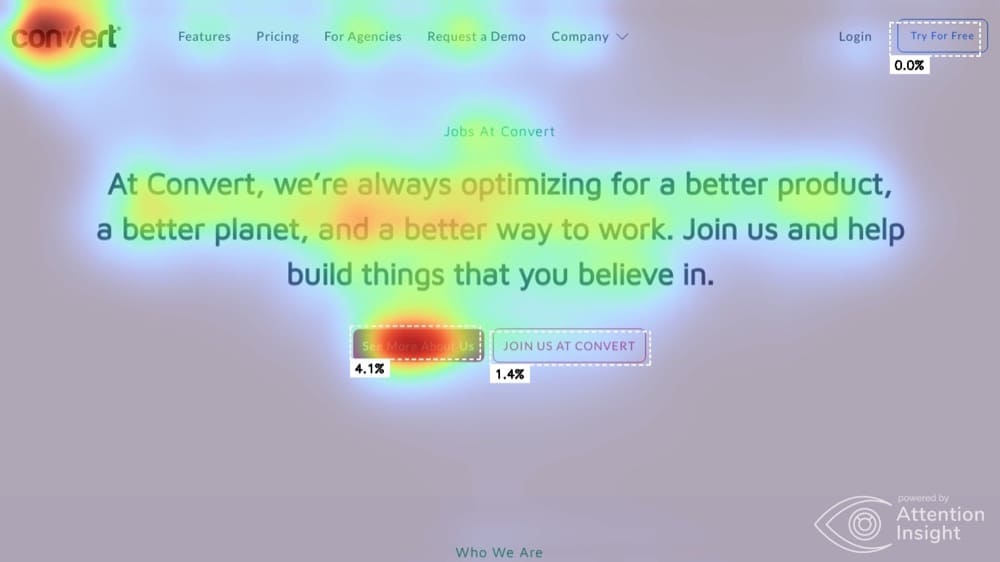
Some tools use AI to predict how attention will be distributed on a page. They indicate where attention is most likely to go based on how the page is designed.
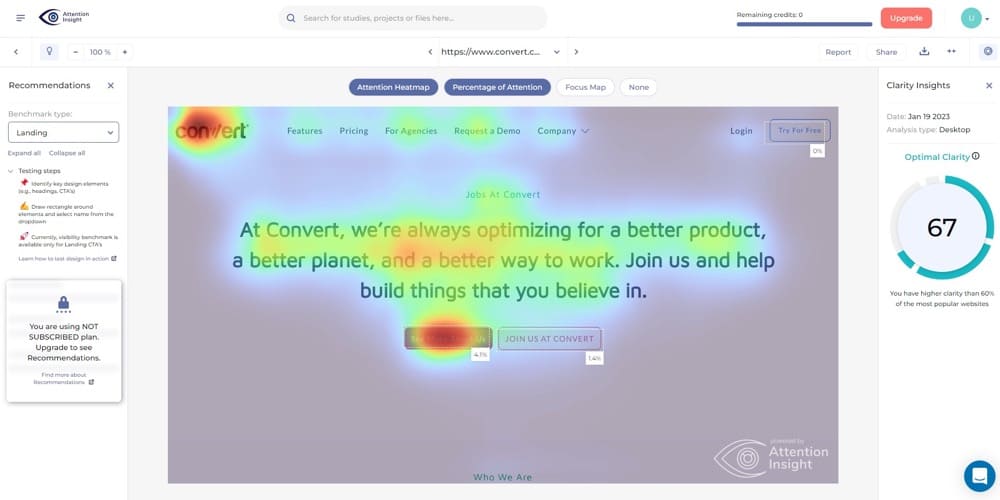
In the example below, Attention Insight suggests the primary CTA and the logo on our Careers page get the most attention.
Another technology in the attention heatmap category is eye tracking heatmapping. More on this under eye tracking heatmaps below.
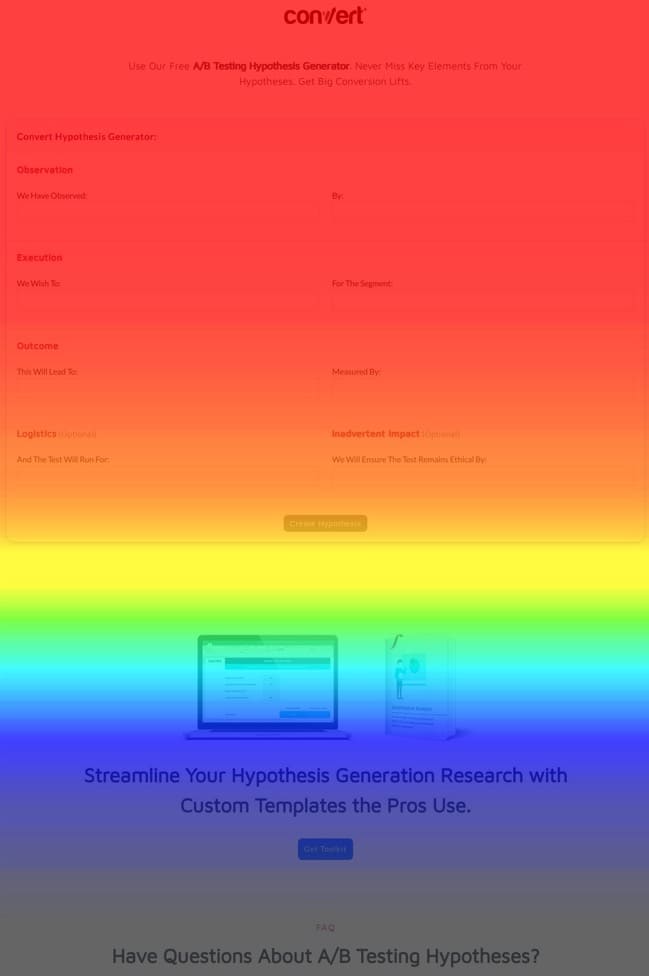
5. Confetti
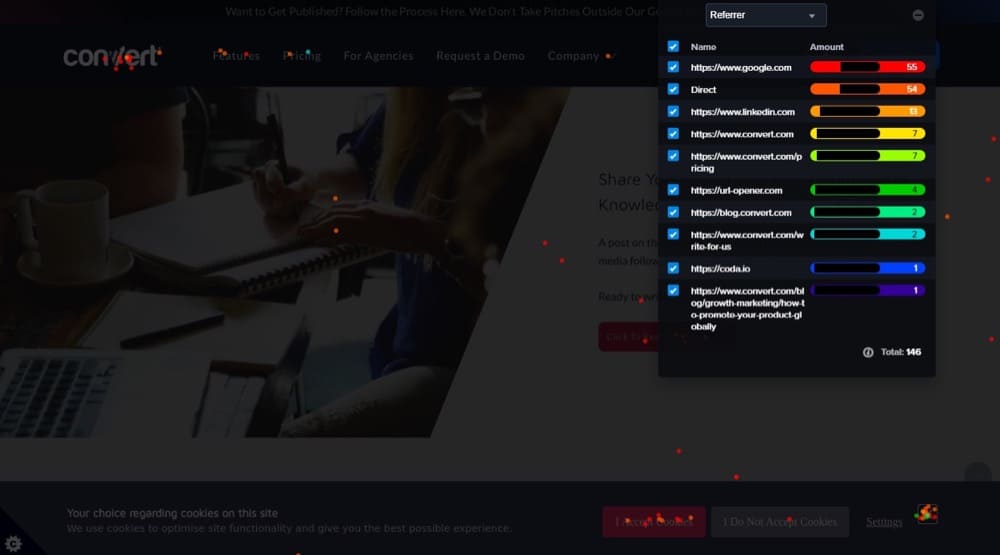
Confetti is a type of heatmap that shows referral sources and the number of clicks they generate.
The confetti heatmap is ideal if you want to understand how visitors from different sources behave, such as where they click most and which sources lead to the most engagement on your site.
To really get the most out of your heatmaps, you’re going to need to use more than one type since they each give you an incomplete perspective on user behavior.
When Are Heatmaps Useful in User Research?
Using heatmaps and session recordings to study user behavior is an important part of experimentation and optimization.
You see, heatmaps are a way to visualize quantitative data — data that tells you what is happening on your website or apps.
As opposed to session recordings, which are a form of qualitative data, like customer interviews, which tell you why these things are happening on your website and apps.
They give you a 360-degree view of the user’s experience, which will allow you to optimize your website and apps and discover new opportunities for experimentation.
Here’s how:
1. Highlight Friction Points
Until you study user behavior on your website or app, there’s no way for you to know for sure that users are interacting with it the way you intended.
And that’s a problem.
Because certain elements may not function as planned, or users may perceive certain features of your design differently than expected.
How would you know? You can ask them, for one. That’s where feedback, polls, and interviews come in. You can also observe them through heatmaps and session recordings.
For example, if you see lots of clicks on an element on your heatmap that isn’t a link, it may be because users expected it to be one.
Another example is when scroll maps show that 80{1652eb1ffa4184925f6a63a9c04ea6b421acb7a78117241e7d4325cdca8339fa} or more of your visitors engage with the FAQs on your product pages. In which case you may want to incorporate those answers into the copy along the funnel.
2. Show Visitor Interaction with CTAs
For marketers, getting that click on the CTA button is everything. You can do everything design- and copy-wise and still miss the mark more times than you’d like. That’s why you need to know what’s going on from your user’s point of view.
With heatmaps like confetti, you can see a picture of how visitors from various sources experience your site. You can learn, for instance, that visitors from LinkedIn tend to be more interested in checking out your pricing first.
Attention maps might show you that sections with interactive slides receive the most attention. If, for example, you want to boost newsletter signups, triggering a pop-up when users scroll to the interactive slides will make the most sense. Not after, when they’ve lost interest.
3. Visualize the Conversion Path
When you visualize your funnel, you can see where visitors are dropping off and where they are converting.
You can get a more granular view of the handover regions of your web pages with heatmaps.
What is the experience like for users on these pages? Are the elements positioned optimally on the pages? Can they easily find the information they need?
Are there opportunities to make the conversion experience even more seamless and intuitive? Heatmaps can show you.
If you know how to use them.
How to Use Heatmaps in Optimization
Heatmaps and session recordings are ideal starting points. However, approaching them without asking the right questions first is like walking into a room without a purpose: you see everything, but find nothing.
To use heatmaps effectively, prepare questions about your users. Then, when heatmaps analyze their habits, you have results to use in tandem with other user behavior data for well-rounded research.
How to Read a Heatmap
What do you see in the picture below?
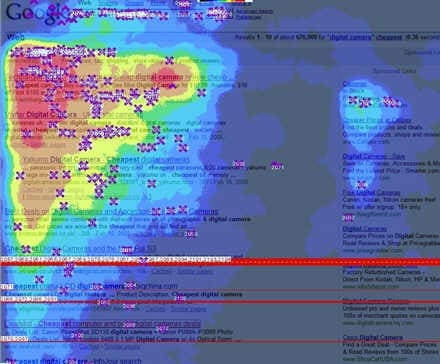
The first thing to understand about heatmaps is color theory. We have a spectrum of hot (red) to cold colors (violet).
Hotness represents a higher data value. So, if we’re looking at attention intensity (measured by mouse hovers and clicks), then the redder sections of the image above indicate more people pay attention to the top left corner of the Google SERPs.
It is important to keep in mind that not every heatmap will present you with relevant data, especially if it is not derived from a sufficient sample size. In CRO circles, the sample size to create accurate heatmaps is 2,000 to 3,000 pageviews per page, per device.
Using heatmaps for optimization also requires segmenting your users. For instance, you would want to exclude users who are part of your organization. Home data does not count.
Remember what we said about starting with a question? This is where it plays out: You can find more relevant answers by segmenting your audience. For example, new users vs returning users: how do their behaviors compare? Organic traffic vs paid traffic: are they interested in different items on the page?
Even more important is segmenting mobile vs desktop visitors. There is a difference in how elements on your page appear in these different viewport sizes.
That’s why it is important to use a heatmapping tool that separates devices — even better if it records user screen resolutions and allows you to segment data by screen dimensions.
Additionally, when reading heatmaps, it is important to capture data during a reasonable timeframe. If your timeframe is too short, you may read biased data. Can you detect average user behavior over a quarter if you observe mostly weekend behavior?
The Limitations of Heatmaps
It’s clear that heatmaps aren’t a perfect tool for measuring user behavior, in particular when used alone. In many ways, they don’t replace actual interviews with customers.
Heatmaps are cheaper alternatives, but here’s where you’ll have to make concessions:
- No clear direction on the next moves
As amazing as they are in aggregating digital experiences on websites and apps, heatmaps do not tell you what you should do about the splotches of colors you’re looking at.
In the absence of this insight, interpretation is left to the heatmap reader.
It’s left to you to come up with a story of what users are experiencing — and that’s if the tool you use allows you to adjust opacity because the color splotches can block your view. (Was that a textbox or a button?)
- Most heatmaps struggle with dynamic elements
Heatmaps were more reliable back when the internet wasn’t so responsive. Now websites are built to adjust and move elements around to fit various screen resolutions. When creating clickmaps, for example, heatmap tools record actions by noting the (X,Y) position of the mouse cursor.
By now you see where this is going. The (X,Y) values for your CTA button on a 1080 x 920 desktop aren’t the same for a 1368 x 768 desktop. A mature tool will be able to translate this most times but may not always get it right.
This problem is even worse with single page applications where element positions on the page can be different for different users at different times.
Do dynamic heatmaps solve the problem? Many optimizers will agree dynamic heatmaps can be noisy at best; displaying hotspots in seemingly empty regions.
Session recordings, although time-consuming, will serve you better in this scenario.
- Tracking clicks and mouse movement is inaccurate eye-tracking
Are you always looking where your mouse pointer is? I’m currently typing this on Google Docs and the mouse cursor is on that wide space on the right.
Most times, your mouse pointer isn’t hovering over the content you’re currently focused on. Conversely, you probably hover over things you’re not particularly that interested in.
Imagine aggregating this data. How would you know it accurately represents your users’ attention?
In fact, in 2010, a Google researcher, Dr. Anne Aula, revealed some damning findings about mouse tracking:
- 94{1652eb1ffa4184925f6a63a9c04ea6b421acb7a78117241e7d4325cdca8339fa} of people showed no vertical correlation between mouse movement and eye tracking
- 81{1652eb1ffa4184925f6a63a9c04ea6b421acb7a78117241e7d4325cdca8339fa} of people showed no horizontal correlation between mouse movement and eye tracking
- 10{1652eb1ffa4184925f6a63a9c04ea6b421acb7a78117241e7d4325cdca8339fa} of people hovered over a link and then continued to read around the page looking at other things.
Meanwhile, another paper released data showing that there’s a strong relationship between gaze position and cursor position.
So, while the researchers disagree on this, one thing is for sure.
You should never use heatmaps as a standalone form of user research – they work best in conjunction with other methods. They provide additional context to issues that are surfaced by qualitative data, like element click tracking.
- Predictive, algorithmic heatmaps are cheaper for a reason
Predictive eye-tracking tools (sometimes marketed as AI-generated heatmap tools) estimate where users focus their attention on a snapshot of your design.
These tools calculate the visibility of elements in the snapshot by analyzing their color, contrast, visual hierarchy, size, etc. This is useful for designers and sites without enough traffic to generate heatmaps.
But it is a poor, unreliable representation of the actual usability of your website or app.
Let’s explore this side-by-side with actual eye tracking.
Follow the Gaze: Eye Tracking Heatmaps
The eye tracking technique analyzes where visitors are looking on a screen. With this ‘gaze data’, the eye tracking map highlights which areas of the web page receive the least and most attention.
How does it work?
Eye tracking involves special equipment that casts a light on the subject’s eyes. A camera in the tracking device is used to track the reflection of the light in the person’s eyes to measure position and movement.
This is then superimposed onto the UI creating two pointers that tell you where the person is looking. One for the left eye and the other for the right.
This is one of the most accurate ways to estimate attention and the resulting heatmap can have global relevance.
But it isn’t widely used because:
- You’ll need an expensive setup, and
- Inviting people to take a test would not feel as organic as letting them experience your site at their own pace.
However, you can circumvent the first challenge by reaching out to an eye tracking service provider. They can work over webcams and provide the testers you need for the usability data.
Must-Have, Non-Negotiable Eye Tracking Platform Features
The following section was kindly provided by Deborah O’Malley, a master’s of science degree holder, specialized in eye tracking technology, and founder of the go-to A/B test case study resource website, GuessTheTest.
Having earned a master’s of science degree with a specialization in eye tracking technology, I’ve been exposed to a variety of eye tracking devices.
As you can see, the technology has evolved from somewhat antiquated massive machines, requiring chin straps, to big bulky computers — like what I used in the mid-2000s — to the sleek, streamlined devices they are today.
Through this evolution, the devices and functionalities have undergone rapid transformation.
But little has changed for the user. What made a good eye tracking device in the past remains consistent today.
Here are the top-four elements that make a useful eye tracking tool:
- Accuracy without restriction
In the olden days, users had to strap their chin into the equivalent of an eye tracking electric chair just to have their eye movements tracked! Fast forward nearly 40 years later into the mid-2000s and users were far less restricted. But, they still needed to sit VERY still, or the device wouldn’t work track very accurately.
Today, many cutting-edge eye trackers allow users to move around freely while still accurately tracking eye movements without restriction. In today’s day and age, a good eye tracker should allow for movement without restriction and without losing tracking accuracy.
- Easy to use
Although eye tracking technologies have greatly evolved, not all are easy to use. A good eye tracker should be intuitive to set up and immediately start using — with little learning required. And all cables and software should be provided.
Back when I did my master’s, I spent days hunting down the right USB cable just to plug in the device! No one should have to go through that kind of torture. So, when sourcing the optimal eye tracker for your needs, make sure all parts and cables are included. This advice includes all hardware and software needed to get up and running out of the box.
- Meaningful data output
The best eye trackers are not only easy to get up-and-running, but also provide useful data output.
When doing my master’s in the mid-2000s, the eye tracker spit out raw numbers which had to be crunched to get any meaning from the data. Talk about an eye sore!
A good, modern eye tracker should provide useful data without having to spend hours writing and running code to analyze or derive meaningful results.
- Usable in any setting
When users know they’re being monitored, they may behave differently. This response can impact the reliability of your results.
The best eye trackers are so small and unobtrusive, users don’t even know they’re there. The most useful eye trackers should be able to be used in both a lab and a natural setting.
Session Recordings and Privacy
A session recording or session replay lets you watch a video of your web visitor navigating your website and interacting with elements on your pages. 99,174 of the top 1 million websites in the world use session recordings to answer questions such as:
- Where do our users get frustrated?
- Where do users quit in the funnel?
- How do users interact with an onboarding sequence?
It’s great for user research. So, you’ll usually find many heatmapping tools having the session recording feature under one branded name or the other.
But they do the same thing: Record the full page source code and text, user mouse movements and clicks, and their keypresses.
This level of data collection raises questions about privacy.
In Session replay scripts: A privacy analysis, the researchers state that “the extent of gathered data [in session replay tools] is intrusive, often going beyond the stated objectives, and often collected without users’ knowledge.”
In those instances where users have to fill forms, payment info, and the like, the recording tool can grab the exact input, store that, and sometimes replay it.
It poses the following risks:
- Autofill abuse
- Password leaks
- Sensitive data leaks
A privacy-conscious heatmap and session recording tool will feature:
- Automatic redaction to hide sensitive data in fields such as payment details, health data, personal data, and passwords
- Support for manual redaction, so you can set which data needs to be hidden across your website
- Anonymity of visitor data
Your organization is responsible for informing visitors about session recording software on your website, whether through a cookie banner or your privacy policy.
Explain what type of data is being collected, why it’s being collected, and what it’s being used for. Only capture what you need and will use. Delete regularly.
How to Choose the Right Heatmapping Tool
There are currently 40 heatmapping tools available on the market, either as standalone products or tools that offer a heatmapping feature.
Should you just go for what’s popular (read: Hotjar) or find a more niche tool that fits your use case and budget better?
Fortunately, we have thoroughly tested and actually used all 40 heatmapping tools for several months, so we have all the information you need. Our in-depth heatmap tools comparison table shows you exactly how to evaluate your options and which tools are the best choice for your particular use case.
We’re also drawing on Deborah O’Malley’s decades of experience — where she’s worked with several clients, across many different industry sectors, and has tried almost every heatmapping platform there is.
Let’s go to the first one…
1. Behavioral Analysis Features
The right heatmapping tool should first and foremost support this purpose.
Heatmaps on their own are only 2-dimensional views into user behavior with (after what we’ve learned above) shaky accuracy.
If you’re paying for a tool, it should augment your heatmaps with session replays and ways to gather actual customer feedback through polls and surveys.
Heatmapping, scrollmapping, session recordings, exit polls, surveys, live chat, funnel analysis, form analytics, and A/B testing capabilities are some of the many functionalities included in many heatmapping platforms. Not all will be needed for the kind of analysis you want to do. But, when selecting a vendor, go with a platform that offers versatile functionality and gives you room to grow with your experimentation and analysis needs.
Deborah O’Malley
Machine learning features such as rage clicks, dead clicks, u-turns, bounces, etc., used to be a sweet addition in the past, but are now absolutely essential. You’ll need them to reveal UX problems and bugs that need fixing.
2. Supported Platforms and Devices
Heatmapping accuracy is limited by screen resolution. You need a tool that’s robust enough to sort visitor screen resolutions into categories. Then you can view the collected data fairly accurately through the same viewport your visitors used.
You don’t want tablet device data mangled with desktop device data. That’s unholy matrimony in CRO.
We know users behave differently on different device types. But not all heatmapping platforms seem to take this factor into account. In order to assemble insights on differing user behavior by device type, you’re going to want to be able to look at heatmapping insights by desktop, mobile, and tablet views.
Not all heatmapping platforms make it easy to switch back and forth between device types. So, when choosing a heatmapping platform, look for one that makes device type switching seamless.
Deborah O’Malley
Also, if you’re a SaaS vendor interested in mapping your app, you want a tool that offers heatmapping for apps and has a dynamic heatmap feature.
Besides clicking, you should be able to capture scrolls, confetti, and hovers using the heatmap tool. You should also be able to switch between these and combine them without much difficulty.
In isolation, seeing how users scroll, or where they click on a page can provide valuable insights into user activity. However, it’s not until these behaviors are combined that a truly meaningful picture emerges. For this reason, it’s important the heatmapping platform you go with enables you to easily switch between scrollmapping and heatmapping views – at the single click of a button. Not all do!
Deborah O’Malley
3. Automatic, Real-Time Monitoring
When I was testing tools for this article, I found two types of heatmap tools.
The first type makes you manually set up the heatmap data collection process on each page before it starts gathering the mouse clicks, hovers, and other data. You then have to wait for it to get populated with your website traffic. I found this extra hoop to jump quite annoying.
The second type of heatmap tool collects data automatically after it’s been installed on the target pages. This is the most convenient method.
With most heatmapping platforms, you’ll need to install a tracking snippet on your site to monitor user clicks, scrolls, and session activities. Once this snippet is installed, it’s nice to not have to do any more set-up.
However, some platforms require you manually add the URL of every single page you want to track. For sites with lots of pages, this task is a huge headache! So, when choosing a heatmapping platform, forgo the manual setup. Instead, go with a platform that automatically starts tracking all pages once the snippet is installed.
Deborah O’Malley
Tools that gather data in real time and don’t make you cross seven seas to create a heatmap are the best.
4. Robust Dashboard with Reporting and Analytics
Tools with magnificent UI, an easy-to-understand dashboard, and a wide range of relevant data with reporting and analytics make user behavior research blissful.
You should consider this when choosing a tool since not every tool provides the data you need in an easy to understand manner. However, there are some tools that do.
For example, custom event tracking isn’t available on every tool but you need it to make better sense of the heatmaps and pull actionable insights from them.
Another feature that makes heatmaps analysis more insightful is full funnel analysis. It helps you look further than the page-by-page analysis and peer into the whole user journey and unravel valuable customer stories.
Let’s not forget predictive analysis. It is not common but if you don’t have sufficient data and aren’t leaning too heavily on accuracy, you’d appreciate this. This can be done with AI or historical data.
Page mapping is one of the most underrated but powerful parts of a good heatmapping tool. The ability to group pages together easily to see how users react to templated pages (like PDP) across the entire site creates valuable insight with stat sig backing.
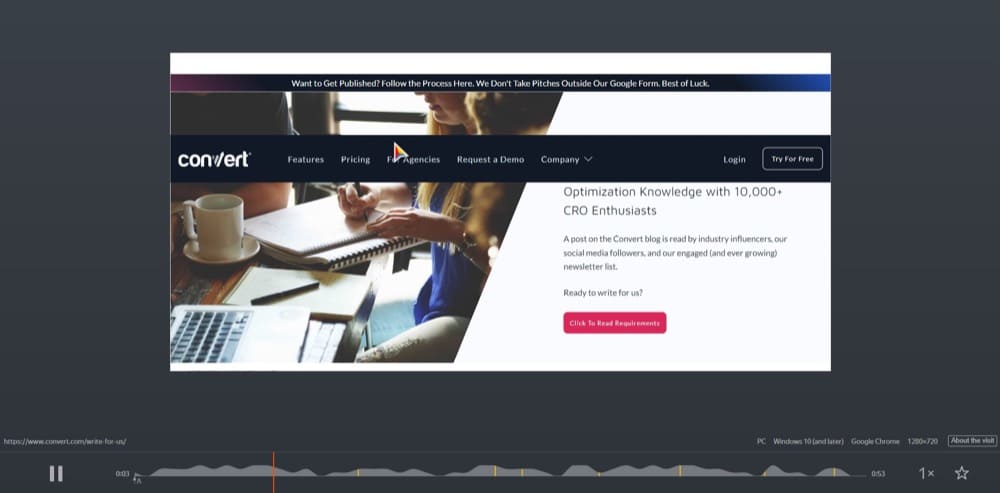
Likewise, heatmapping needs sessions tied to it, but you need to know when to watch those sessions, so the tool needs to move from macro to micro. For an example I made this for a client explaining Mouseflow to them, it is meant to showcase how each part of the platform supports each other allowing us to fully understand the user.
Kevin Szpak (Rise Interactive)
What about collaborative features? Some tools can make downloading your heatmaps a hassle.
In order to share insights with your team, stakeholders, or clients, you’re going to need to be able to take a snapshot of the heatmapping or scrollmapping view on the pages you’re assessing.
While most platforms allow you, in some way shape, or form, to capture the page insights, not all easily enable you to simply grab a picture and download the view so you can insert it in emails, reports, or presentations. Some platforms require you to go through a rigmarole of steps simply to share or send the image.
The best platforms have a download button where you can simply capture the heatmap or scrollmap image as a picture file, in full screen, and easily insert it into any presentation format.
Deborah O’Malley
Other collaborative features that make sense in session recordings are the ability to add tags and annotate specific timestamps in the video.
5. Data Privacy
You want to maintain respect for privacy, especially when studying user behavior across your marketing touchpoints. If you’re going to be bringing a third party into your relationship with your customer, ensure they share the same privacy values.
While setting up your account, don’t just tick “read the privacy policy and terms and conditions” and be on your way. Check it out and make sure it aligns with your values.
Ensure you’re offered privacy by default. It’s a red flag if you have to go into settings to do those yourself.
6. Integrations
Your heatmap tool cannot exist on its own without playing nice with the rest of your martech stack, especially your analytics tools.
What about your CMS and other marketing software? It’s a huge plus to integrate those too. At the very least, however, if you intend to do more with your heatmaps, you want a tool that integrates with Zapier for custom workflows.
7. (Bonus) Free Trial
Before committing to a monthly or annual fee, you need to know if the tool fits your optimization goals.
40 Heatmap and Session Replay Tools to Track User Behavior
We talked to CRO and marketing experts and scoured the web to find the 40 tools below. With varying levels and areas of strength, they can help you create heatmaps and replay sessions to track and understand your users’ behavior.
But that’s the thing… “varying levels and areas of strength”. Since you shouldn’t have to burn hours of your time exploring those strengths and weaknesses to find which suits your use case best, we’ve done it for you.
From our research talking to marketers and optimizers like you, we isolated qualities of heatmap tools that matter, such as:
- The use case the tool is built for (e.g. SaaS product design, ecommerce CRO, mobile app design, etc.)
- Effect on page loading speed because installing codes on your website can take a toll on UX
- Reporting and analytics: At the end of the day, how can the heatmap tool support you in making sense of your data?
- Machine learning abilities that present insights such as rage clicks and u-turns
- Sharing and collaboration qualities of the tool, because we often never work alone
- Customer support so you know what’s available to you for when you need unblocking
- Integrations with A/B testing tools and Google Analytics to play well with other tools in your MarTech stack
- Trackable devices and platforms: Some tools work with websites but can’t analyze SPAs
- Support for surveys, polls, and customer feedback
- Presence of a free trial because you’d definitely like to see things for yourself
You see, it’s pretty in-depth. You’re in great hands.
Without further ado, let’s review the mouse tracking, scroll tracking, and user session replay tools that can help you create insightful heatmaps and watch user sessions.
Open Source Heatmap Tools
Here are some open source (and free) tools:
Heatmap Tools That Are Free Forever
Heatmap tools that offer a free plan without time limits:
Meanwhile, tools that have a free tier with no time limits are:
These tools work best for small teams that don’t have the budget for a heatmap tool and don’t have the traffic flow to justify paying for it either — but you need the time to gather enough hits on your heatmap to trust your data.
Heatmap and Session Replay Tools Full Comparison Table
Heatmap and Session Replay Tools Comparison Table
A quick note about assessing a heatmap tool’s effect on page speed:
We use the Time To Interactive (TTI) metric from PageSpeed Insights. Why? It represents how users perceive page performance and interaction. We measured the page speed before and after installing the code (ΔTTI).
When the TTI change for the page after correctly installing the tool is over 0.2s, it is tagged as a “noticeable effect”.
Why the 0.2 seconds difference? That’s the time it takes for humans to detect visual stimuli. In layman’s terms, it’s the time it takes for people to see that a page isn’t responsive to input. It is usually affected by the JavaScript payload of your page.
Here are the page speed effect tags and what they represent:
- No effect: ΔTTI = 0 seconds
- Unnoticeable effect: ΔTTI = 0 – 0.2 seconds
- Noticeable effect: ΔTTI > 0.2 seconds
Note: No tools pushed the test pages to over 3.8 seconds TTI, which is a good TTI score. Granted, the pages are well optimized, but if you were already pushing the extremes towards 5 seconds TTI, you’d want to be careful with what you add to your website.
And a final note about the overall score:
The overall score indicates how heavily we recommend the tool to you, based on our tests and analyses. It is not a direct reflection of how awesome the tool is in general (we have G2 and TrustRadius ratings for that). Instead, it shows how reliably the tool supported our user research with heatmaps and session replays.
Now, let’s get into the detailed overview of each tool…
1. Browsee
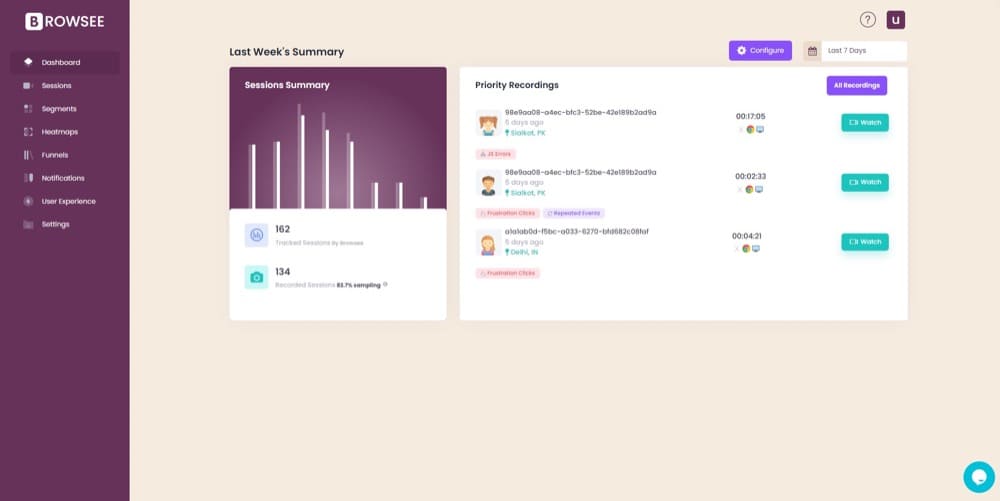
Browsee is a user behavior monitoring and analysis tool for websites and SPAs featuring session recordings, heatmaps, funnels, and feedback forms. It’s built for understanding and optimizing the customer experience and supports dynamic pages and page elements. It integrates with Shopify for ecom, chat tools for customer experience monitoring, and NPM template for SPAs support.
Overall score (based on our test and analysis): 6/10
G2 Rating: 4.9/5 from 13 reviews
Ideal use case: Customer experience optimization for SaaS and Ecommerce businesses
Pros
- Great interface for beginners — lightweight and right to the essentials
- You can create custom dashboards
- Session replay quality is top-notch
- Easy to use
- Shows JavaScript errors
Cons
- No custom dimension views in the heatmap viewer
- No integration with A/B testing tools
Pricing: Starts at $12/mo
Free trial? Yes
Trackable devices and platforms: Mobile, Desktop, and Tablet
Effect on page loading speed: Noticeable effect
Reports & results:
- Session replay
- Click map, scroll map, attention map, and pattern
- Click analysis
Session recordings & surveys? Session recordings, yes. Surveys, no.
Automatic data capture? Yes
Filters and segmentation: Yes
Rage clicks & U-turns: No
Integration with Google Analytics: Yes
Integration with A/B testing tools: No
Other integrations: WordPress, NPM template for SPAs, Intercom Chat, Shopify, etc.
Custom event tracking: No
Sharing & collaboration features: There aren’t many. Results can be emailed and shared.
Other conversion-driving features: Segment analytics and visual analysis of funnels and userflow
Data privacy: GDPR compliant, plus it doesn’t record sensitive input fields by default
Customer support: Live chat, documentation, and FAQs for the various features
Positive review
Critical review
There were no critical comments about Browsee on G2.
2. Capturly
Capturly is a funnel analytics tool that combines the power of heatmaps and session replays to give you a visual of your customers’ experiences with your websites.
It’s designed to help you with usability testing, customer support, bug fixing, and campaign validation. This means you get some of the basic features you’d get from a tool like Google Analytics but matched with data visualization tools.
Overall score (based on our test and analysis): 6/10
G2 Rating: 4.8/5 from 11 reviews
Ideal use case: Website analytics for most types of websites and SaaS product UX optimization
Pros
- It’s lightweight but effective
- Unlimited heatmaps on the free plan
- 1,000 recorded sessions on the free plan
- You get rule settings for session recordings on the growth plan
Cons
- If you switch from paid to a free plan, your recorded data will be lost
- The heatmaps feature isn’t as robust as others we’ve tried
- Only one website per subscription
Pricing: Starts at $23/mo (billed annually) and $29/mo (bill monthly)
Free trial? Yes
Trackable devices and platforms: Websites and SPAs
Effect on page loading speed: No effect
Reports & results:
- Click maps, scroll maps, and segments
- Session replay
- Web analytics
- Conversion funnel analytics
Session recordings & surveys? Yes for session recordings, no for surveys
Automatic data capture? Yes
Filters and segmentation: Yes
Rage clicks & U-turns: No
Integration with Google Analytics: No
Integration with A/B testing tools: No
Other integrations: Webshop
Custom event tracking: Yes
Sharing & collaboration features: A few
Other conversion-driving features: Conversion funnels
Data privacy: GDPR compliant
Customer support: Email support, documentation, and guides available
Positive review
Critical review
The only remotely critical review comes from 2020:
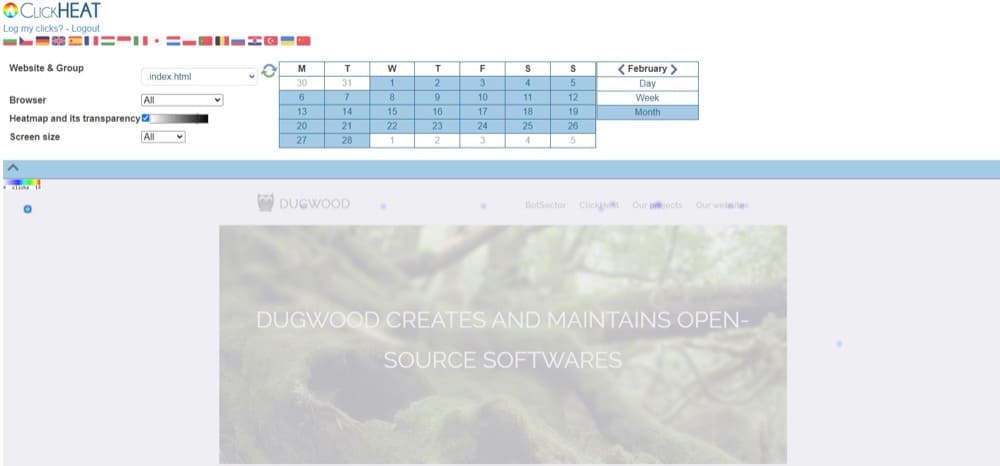
3. ClickHeat
ClickHeat by Dugwood (or LabsMedia’s ClickHeat – former name) is an open source heatmap tool released under the GPL license for website user behavior visualization.
It’s totally free and similar to other tools and uses JavaScript to track clicks and monitor mouse movement. It also uses PHP and GD to log clicks and generate heatmaps.
For a demo experience, log in with username “demo” and password “demo”.
Overall score (based on our test and analysis): 4.5/10 (Our context in this article demands more functionality from the tool)
G2 Rating: 4 out of 5 from 1 review
Ideal use case: Bare-bones heatmaps for websites
Pros
- You can sort heatmaps into 9 different screen sizes
- It’s lightweight and focuses on the essentials if all you care about is heatmaps
- Cool customer service for a free tool
Cons
- Takes quite some time to generate a heatmap image
- You need tech skills to use this one
- It has to be self-hosted
- Might be slow on Firefox
Pricing: Free.
Free trial? It is free forever.
Trackable devices and platforms: Websites on most browsers and screen sizes
Effect on page loading speed: N/A
Reports & results: Heatmaps only
Session recordings & surveys? No
Automatic data capture? No
Filters and segmentation: No
Rage clicks & U-turns: No
Integration with Google Analytics: No
Integration with A/B testing tools: No
Other integrations: None
Custom event tracking: No
Sharing & collaboration features: No
Other conversion-driving features: None
Data privacy: That’s up to you since you’re hosting this on your server
Customer support: You can reach out to the developers via email
On G2, it has only one review:
4. ClickStory
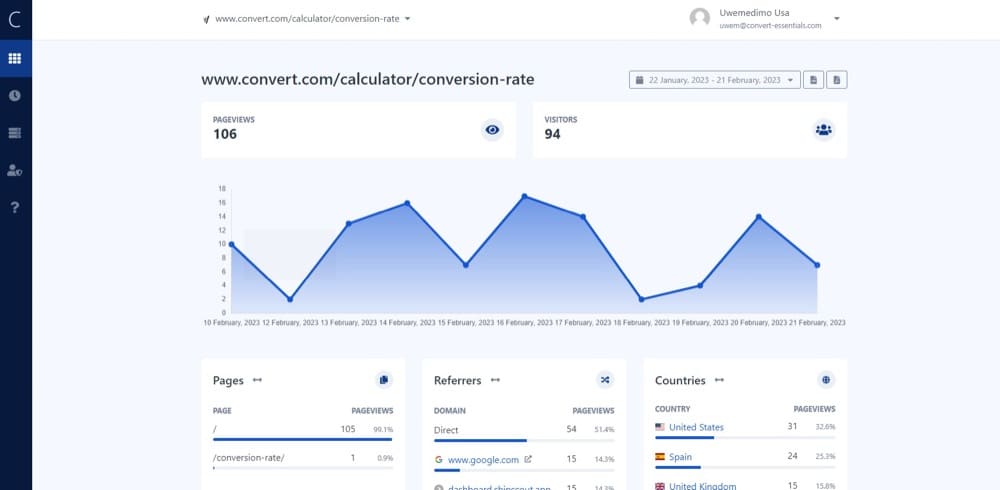
ClickStory is a user session analytics tool that tracks your user journey and also collects heatmaps and session recordings.
It’s still in its early stages of development.
Overall score (based on our test and analysis): 4/10
Rating: None out there
Ideal use case: Lightweight web analytics for websites
Pros
- Great for small teams with few needs in analytics and user behavior monitoring
- Clean and easy to grasp UI
Cons
- Still in its infancy – the website still has “Lorem ipsum” testimonials
- Holds onto session replays for only 7 days on the free plan
- Lacks many useful features
Pricing: Starts at $10/mo and $97/year
Free trial? Yes, for only 1 website and up to 1,000 pageviews per month
Trackable devices and platforms: Websites on desktop, mobile, and tablet devices
Effect on page loading speed: Unnoticeable effect
Reports & results:
- Web analytics
- Heatmaps
- Session replays
Session recordings & surveys? No surveys but you can record sessions
Automatic data capture? Yes
Filters and segmentation: No
Rage clicks & U-turns: No
Integration with Google Analytics: No
Integration with A/B testing tools: No
Other integrations: You can pull data through API in JSON format
Custom event tracking: No
Sharing & collaboration features: You can begin to team up on the $10/mo plan
Other conversion-driving features: None
Data privacy: You own all your data and you can delete at any time
Customer support: There’s a short documentation. That’s it.
Reviews: None found
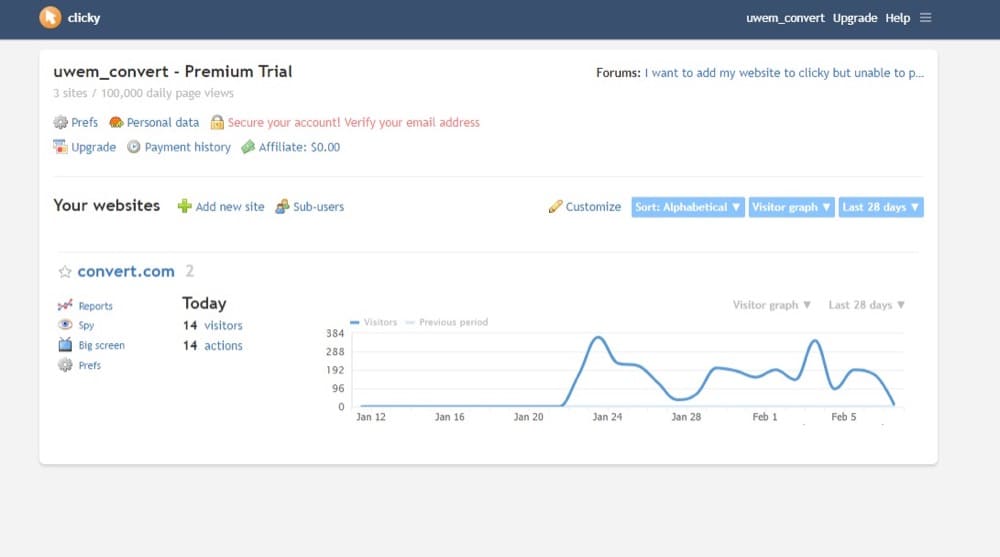
5. Clicky
Clicky is a real-time web analytics tool that also offers heatmaps. It’s a straightforward way to understand web visitor behavior and generate heatmaps to visualize that behavior.
Although the UI looks ancient, it’s popular among webmasters and some marketers. It even lets your segment clicks based on target criteria and track users based on specific goals.
Overall score (based on our test and analysis): 7.5/10
Rating: 4.4 out of 5 from 26 reviews on G2 and 4.2 out of 10 on TrustRadius
Ideal use case: Web analytics for most websites
Pros
- Easy to understand and use
- You get a Google Chrome widget
- Plugs into WordPress, Shopify, Wix and many other CMS and website creation tools
- Lightweight but powerful with extensive features
- Great pricing
Cons
- You don’t get heatmaps unless you pay for the $14.99/mo plan
- No session recording feature
- In UTM attribution, only “campaign” is track; no “source” and “medium”
- Only one year of data is visible on the charts, you can’t view 2 or 3
Pricing: Starts at $9.99/mo
Free trial? Yes, there’s a free forever plan
Trackable devices and platforms: Most browsers, various screen resolutions
Effect on page loading speed: No effect
Reports & results:
- Extensive web analytics
- Heatmaps
- Segments
- Path analysis
- Engagement reports
Session recordings & surveys? No
Automatic data capture? Yes
Filters and segmentation: Yes
Rage clicks & U-turns: No
Integration with Google Analytics: No, it competes with Google Analytics
Integration with A/B testing tools: Yes, it integrates with Convert and VWO
Other integrations: You can use APIs to extract your data in XML, JSON, serialized PHP, and CSV formats
Custom event tracking: Yes
Sharing & collaboration features: You can download reports via email
Other conversion-driving features: Campaign tracking, advanced segmentation, custom goal tracking, and spy (real-time stream of people on your website)
Data privacy: Clicky places a lot of importance on privacy, protects personal data, and is GDPR compliant
Customer support: There are lots of guides, a forum, and you can contact support through email
Positive review
Review with some criticism
6. Contentsquare (Clicktale)
Clicktale is now part of Contentsquare, the Digital Experience Platform (DXP) for customer experience analytics on websites, web apps, and mobile apps. It’s an extensive tool with various features and integrations for effective customer experience analytics and insights.
Contentsquare is big on privacy and accessibility.
Overall score: 8/10
Rating: Contentsquare’s rating on G2 is 4.6/5 from 375 reviews and 8.5/10 from 59 reviews on TrustRadius
Ideal use case: Enterprise-grade digital experience analytics
Pros
- Impressive, fast customer service
- Easy to use with an intuitive interface and visualizations
- Flexibly track a wide range of metrics and behaviors
Cons
- No transparent pricing
- Probably too big for you if you’re only looking for heatmaps and session replay features
Pricing: You’ll have to speak to sales.
Free trial? No. You can, however, get a demo.
Trackable devices and platforms: Websites on desktop, tablets, and mobile devices; web apps; mobile apps
Effect on page loading speed: The impact on page loading speed cannot be determined. We didn’t receive a response when we requested a trial.
Reports & results:
- Web analytics
- Session replay and heatmaps
- Customer experience insights
Session recordings & surveys? Yes
Automatic data capture? Yes
Filters and segmentation: Yes
Rage clicks & U-turns: Yes but as AI-based frustration score
Integration with Google Analytics: Yes
Integration with A/B testing tools: Integrates with Convert, AB Tasty, Optimizely
Other integrations: API, Usertesting, AWS, Salesforce, and many, many more
Custom event tracking: Yes
Sharing & collaboration features: Uncertain
Other conversion-driving features: You can visualize metrics for each page element through a feature called zoning
Data privacy: GDPR- and CCPA-compliant; SOC 2 Type 2 compliant
Customer support: There’s training and certification as well as a Zendesk help center
Positive review
Critical review
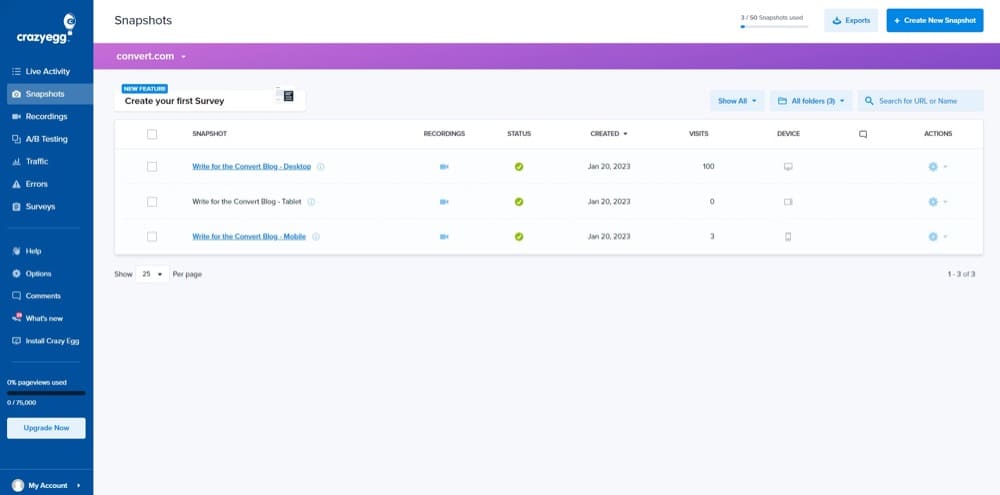
7. Crazy Egg
Crazy Egg is one of the more popular website optimization tools that’s been around since 2005. It features session recordings, heatmaps, surveys, error tracking, and A/B testing.
This tool can be a valuable ally in optimizing user experience, especially if you don’t want over-the-top features. Great for small and mid-sized businesses.
Overall score (based on our test and analysis): 9/10
Rating: 7.9 out of 10 on TrustRadius (128 reviews) and 4.2/5 on G2 (101 reviews)
Ideal use case: Website optimization on mobile, tablet, and desktop devices.
Pros
- You can add team members without additional charges
- Unlimited surveys, A/B tests, and websites in the basic plan, which also comes with 30K tracked pageviews and 100 recordings/mo
- Great, helpful support team
- Lean and focused on heatmaps, session recordings, and surveys
- Super insightful confetti
Cons
- Only 25 heatmaps a month in the basic plan
- All plans are billed annually, you cannot pay monthly
- When your free trial expires, you lose access to your data until you subscribe
Pricing: Starts at $29/mo for the basic plan
Free trial? Yes, for 30 days
Trackable devices and platforms: Most browsers on mobile, tablet, and desktop devices.
Effect on page loading speed: Noticeable effect
Reports & results:
- Confetti
- Scroll map and click map
- Session replays
- Traffic analysis
Session recordings & surveys? Yes
Automatic data capture? Yes, but you have to manually set up heatmaps for every page you’re tracking. It won’t automatically create them across the website.
Filters and segmentation: No
Rage clicks & U-turns: Yes
Integration with Google Analytics: Yes
Integration with A/B testing tools: Yes, including Convert
Other integrations: Uses Zapier to connect to over 5,000 apps including HubSpot, Slack, and Asana; API is also available
Custom event tracking: No
Sharing & collaboration features: Yes, you can work as a team in Crazy Egg and even take it to Slack
Other conversion-driving features: Surveys and traffic analysis
Data privacy: Respects Do Not Track (DNT) settings by default
Customer support: Email support, support tickets, video tutorials, and lots of documentation in the knowledge center.
Positive review
A critical review
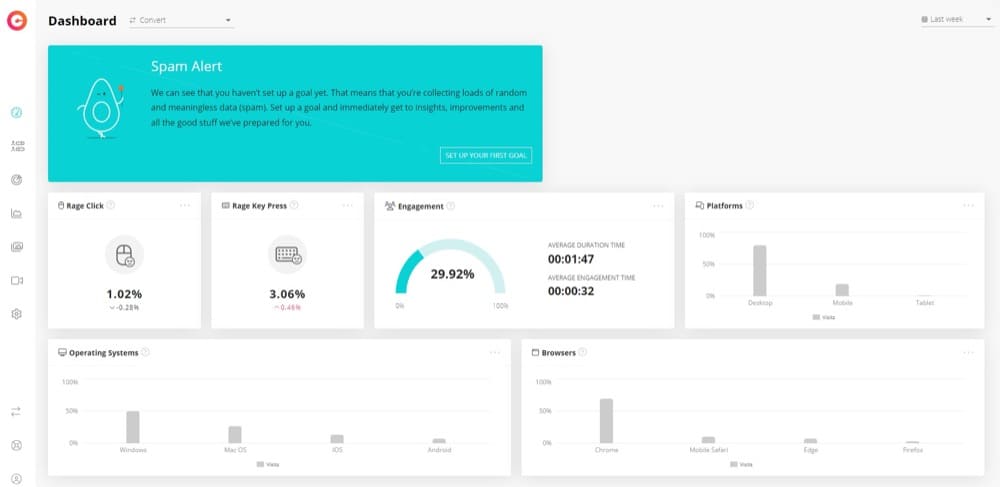
8. CUX
CUX is tagged “the first analytical tool for UX automation”. That’s because it can recognize, detect, and define behavioral patterns of users and track that in line with your business goals. It’s all about providing a better customer experience and increasing sales with this tool.
UX automation uses machine learning to run predictive analysis on how users are experiencing your website or application, highlighting frustrations and problems.
Overall score: 8.5/10
G2 Rating: 4.8/5 stars based on 46 reviews
Ideal use case: UX research and optimization for websites and applications, particularly great for ecommerce
Pros
- Excellent customer support
- Easy to use without having to talk to developer
- Great event tracking feature
Cons
- There’s quite a learning curve to fully utilize it
Pricing: Starts at ~$84/mo
Free trial? Yes for the first 1000 visits
Trackable devices and platforms: Websites and applications
Effect on page loading speed: No effect
Reports & results:
- Heatmaps
- Session replays
- ML data like rage clicks, zooms, and rage key press
- Engagement data
- Web visitor analytics
Session recordings & surveys? Session recordings, yes. Surveys, no
Automatic data capture? Yes
Filters and segmentation: Yes, you can also use filters via identity collected through API
Rage clicks & U-turns: Yes
Integration with Google Analytics: Yes
Integration with A/B testing tools: No
Other integrations: Shoper, Google Tag Manager
Custom event tracking: Yes
Sharing & collaboration features: No
Other conversion-driving features: Custom goals tracking and conversion waterfalls
Data privacy: GDPR compliant, data is stored in EEA, SSL secure, and personal data is anonymized
Customer support: Live chat support and dedicated customer success manager but only on the enterprise plan.
Positive review
This is the only review that is remotely critical
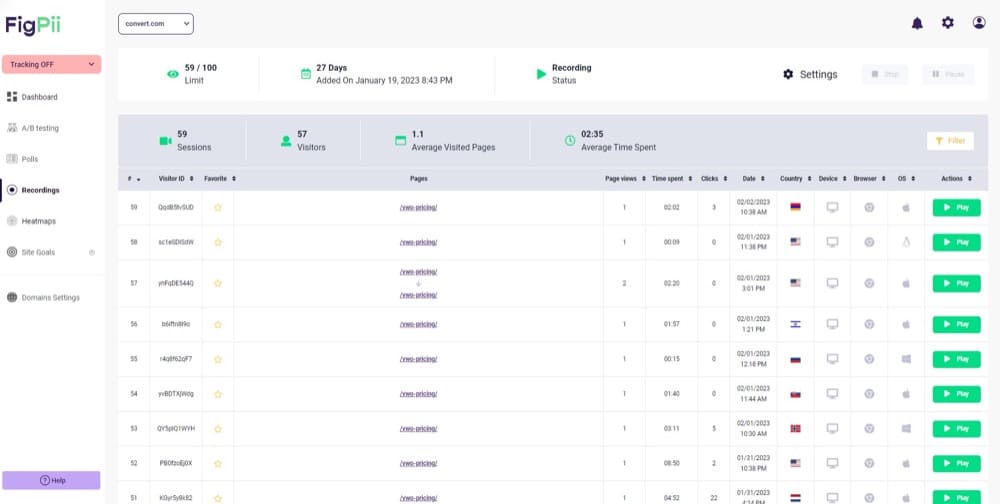
9. FigPii
FigPii is designed to be an all-in-one conversion rate optimization platform. Its mission is to help you identify conversion issues on your website so you can fix them and uncover better experiences for your users.
It does this with heatmaps, session recordings, polls, and A/B tests. Another cool feature is that it uses ML and your visitor data to suggest ways to improve issues spotted on your website.
Overall score (based on our test and analysis): 6/10
G2 Rating: 5/5 from 3 reviews
Ideal use case: Website user research and conversion rate optimization
Pros
- Easy to use and quick to arrive at insights
- Matches qualitative insights with actionable conversion tips
Cons
- Unsteadiness with the heatmaps and video recordings
- You don’t get FigPii recommendations unless you’re on the $339.99/mo plan
Pricing: Starts at $99.99/mo
Free trial? Yes, for 14 days
Trackable devices and platforms: Websites on desktop, mobile, and tablet devices
Effect on page loading speed: No effect
Reports & results:
- Heatmaps
- Session replays
- Goals tracking
Session recordings & surveys? Yes
Automatic data capture? No
Filters and segmentation: No
Rage clicks & U-turns: No
Integration with Google Analytics: Yes
Integration with A/B testing tools: None because it has A/B testing
Other integrations: WordPress, Shopify
Custom event tracking: Yes
Sharing & collaboration features: None
Other conversion-driving features: A/B testing and goals tracking
Data privacy: CCPA and GDPR compliant
Customer support: Via live chat, email chat, and a knowledge center
Positive review
Negative review
None as at the time of this report
10. FullStory
You get FullStory’s session recording and heatmap solutions with the Digital Experience Intelligence (DXI) platform. Among other features, it comes with product analytics for web and mobile experiences and collaboration tools.
Through FullStory, you can monitor and analyze your customer’s behavior and find opportunities to boost conversions based on their experiences with your digital assets.
Overall score (based on our test and analysis): 9/10
G2 Rating: 4.6/5 from 239 reviews
Ideal use case: Digital experience optimization for various industries, on apps and websites
Pros
- Top-notch customer support team
- Actionable conversion reports
- And this:
One of the biggest limitations I see with many session recording tools is the fact they only show interactions with a specific page, rather than a series of pages. This means your insights are hugely limited. FullStory quite literally offers the full story by showing your users’ entire session reply, spanning not just a single page, but multiple pages including interaction with any on-page elements like video. This makes FullStory the best overall session cam tool in my opinion.
Angus Carbarns, Founder of We Are Engines
Cons
- No transparent pricing
- Inflexible dashboard layout
- Setting up micro-conversion checkpoints can be tedious for non-techies
Pricing: You have to contact sales by requesting a demo
Free trial? Yes, for 14 days. (But you may not find it. It’s currently ‘hidden’ below the “Get a Demo” button in the Business section of the pricing plans)
Trackable devices and platforms: Mobile apps, web apps, and websites
Effect on page loading speed: Noticeable effect
Reports & results:
- Funnel and segments analysis
- Click maps and scroll maps
- Session playlist
Session recordings & surveys? Yes to both
Automatic data capture? Yes
Filters and segmentation: Yes
Rage clicks & U-turns: Yes, and dead clicks too
Integration with Google Analytics: Yes
Integration with A/B testing tools: Yes. Convert, AB Tasty, Kameleoon, SiteSpect (require manual setup)
Other integrations: Slack, Intercom, Snowflake, Jira, plus API
Custom event tracking: Yes
Sharing & collaboration features: Yes, including a feature called “Notes” where you and your team can keep session notes and find suggestions from FullStory’s Helpbot.
Other conversion-driving features: User digital journey analysis and conversion funnel tracking and analysis
Data privacy: GDPR, CCPA, SOC 2 Type 2 compliant. You control the data FullStory captures and stores.
Customer support: Knowledge base, email support, live chat, FAQs, and phone support are all available.
Positive review
Critical review
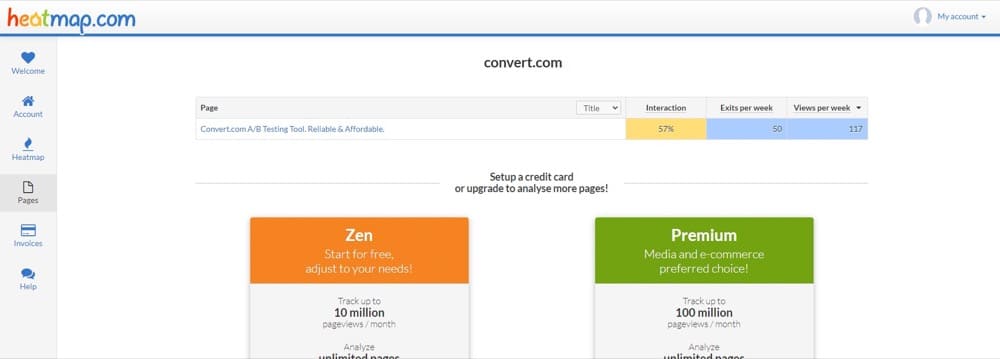
11. Heatmap.com
Heatmap.com is probably the leanest heatmap tool. The only additional features are conversion tracking, template analysis, and real-time stats of your website.
Beginners and those who just need the tool for heatmaps will find it ideal. Because you’re not going to get the other features that make heatmaps more than just rainbow colors overlaid on your website pages.
Overall score: 4/10
G2 Rating: 4.2/5 from 3 reviews
Ideal use case: SaaS web analytics
Pros
- Super generous free plan
- Lean heatmap tool if all you want to do is heatmaps
Cons
- UI looks dated
- Lacks a lot of features that make heatmaps more useful
Pricing: Premium starts at $100/mo after a 30-day free trial
Free trial? Yes. In fact, the zen plan is free for up to 10 million pageviews/month
Trackable devices and platforms: Websites and web applications (might not support dynamic elements)
Effect on page loading speed: No effect
Reports & results:
Session recordings & surveys? No
Automatic data capture? No, you have to manually setup the heatmap before data collection begins to paint the map
Filters and segmentation: No
Rage clicks & U-turns: No
Integration with Google Analytics: No
Integration with A/B testing tools: No
Other integrations: No
Custom event tracking: No
Sharing & collaboration features: No
Other conversion-driving features: Conversion tracker
Data privacy: Respects “Do Not Track” browser settings with the option to opt-out at any time, GDPR-compliant
Customer support: Support requests
Positive review
Closest thing to criticism
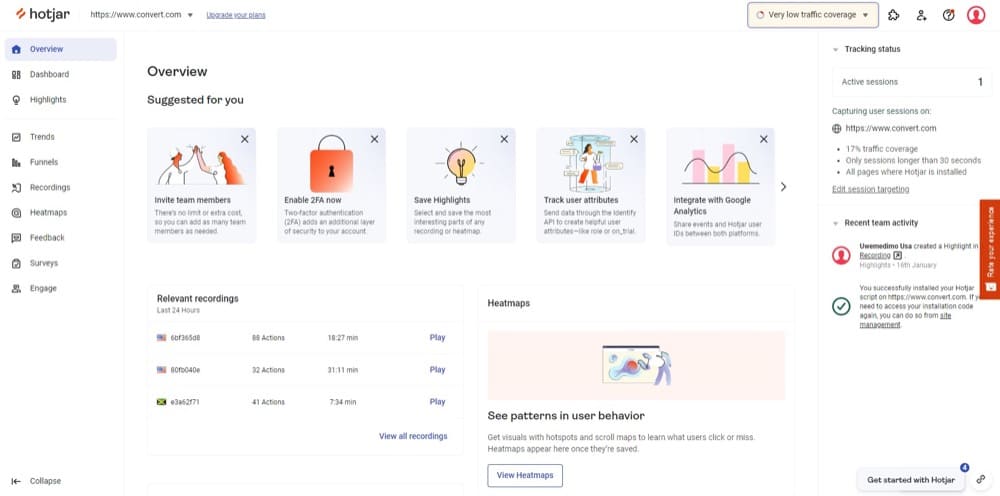
12. Hotjar
Hotjar may be the most recognizable name on this list. It’s by far the most popular tool and the one most marketers will think about as their first encounter with heatmaps and session recordings.
For digital marketers, it is a conversion rate optimization tool, while for product teams, it is a product experience insight platform. You can use its powerful features to research how users experience your website and web applications.
Overall score: 8/10
Rating: 4.3/5 from 274 reviews on G2 and 8.4/10 from 313 reviews on TrustRadius
Ideal use case: User experience research and optimization for websites in varying industries
Pros
- Generous free plan
- Feels intuitive to use with a spacious and relevant dashboard
- Emojis in the session recording player help you tag bugs, UI/UX issues, frustrations, conversion, etc.
Cons
A lot of people we spoke to used or have used Hotjar. It’s a really popular heatmapping tool. We’ll let them share their experience here:
One of the biggest frustrations with using Hotjar is the inability to customize heatmap colors. The default color scheme is quite bright and can be difficult to differentiate between, especially when you’re trying to track multiple items on the same page at once.
I also wish there was an easier way to create a custom heatmap for each page of my site—right now, it seems like I have to create a whole new account just for each new site I want to analyze.
Michael Miller, CEO and Security Evangelist at VPNOnline.com
Sometimes the heatmap doesn’t fully capture a full screengrab of the webpage. Because of this, I have to go on the site to see what area was not properly shown so I can then assess the sections that had some important mouse movement and clicks (especially to specified CTA buttons).
Omar Ruiz, LMFT, Founder of Online Private Practice, LLC
In our agency, we use Hotjar as our Heatmap & Session Replay Tool. We love its screen recording capabilities. This makes for a robust understanding of how our audience is using a website.
The disappointing area of Hotjar is that even though its analytics combine with CRO and user feedback, they are not as detailed as we would love.
Paula Glynn, Director of Search Marketing & Digital Strategy of Pixelstorm
Pricing: Heatmaps and recordings start at $32/mo if you don’t want to use the $0 basic plan
Free trial? Yes, the basic plan is free forever.
Trackable devices and platforms: Websites: mobile, desktop, and tablet
Effect on page loading speed: No effect
Reports & results:
- Customer feedback and surveys
- User segments
- Heatmaps (Click maps, scroll maps, confetti)
Session recordings & surveys? Yes, but surveys are available on a different pricing package called “Ask” and start at $48/mo on the Plus plan. But it is free on the basic plan where your limit is 20 responses per month.
Automatic data capture? Yes
Filters and segmentation: Yes
Rage clicks & U-turns: Yes
Integration with Google Analytics: Yes
Integration with A/B testing tools: Yes, with Convert, Optimizely and Google Optimize
Other integrations: Zapier, Slack
Custom event tracking: Yes
Sharing & collaboration features: Among other sharing features, it works with Slack to enable collaboration
Other conversion-driving features: Funnel analysis, feedback, and surveys
Data privacy: Hotjar doesn’t record sensitive data and even redacts input in the session replay by default; it is also CCPA and GDPR compliant
Customer support: Pre-recorded demo, live chat, knowledge base, support tickets, documentation, and video tutorials available.
Positive review
Critical review
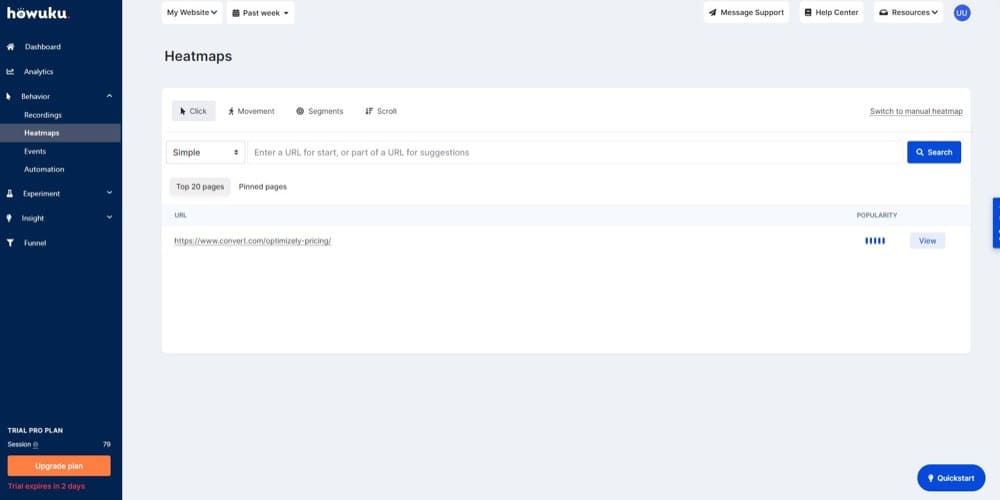
13. Howuku
Howuku is a behavior and UI/UX analysis platform with heatmapping, session recording, surveying, and A/B testing features to help you unlock user behavior insights to improve content engagement and page performance.
Howuku is a budget-friendly marketing optimization ally that even product owners will find absolutely valuable for real-time feedback.
Overall score: 8/10
G2 Rating: 5/5 based on 2 reviews
Ideal use case: Startup-friendly SaaS product UX and website optimization for online businesses
Pros
- Has dynamic heatmaps
- Beautiful, easy-to-grasp dashboard of relevant web analytics
- Has event automation capabilities for SMS, Telegram, and Slack
- Has a free AI-generated heatmap tool
- Agencies can white-label Howuku
Cons
- When your free trial expires, you lose access to your data (would be better to stop capturing new data)
Pricing: Starts at $24/mo
Free trial? Yes, for 14 days
Trackable devices and platforms: Websites on tablets, phones, and desktop devices
Effect on page loading speed: No effect
Reports & results:
- Click map, scroll map, movement map, and segments
- Conversion funnel analysis
- Session replay with events timelines
- Web analytics
Session recordings & surveys? Yes
Automatic data capture? Yes
Filters and segmentation: Yes
Rage clicks & U-turns: Yes
Integration with Google Analytics: Yes, through Zapier or Pabbly
Integration with A/B testing tools: No, it has its own A/B testing visual editor
Other integrations: WordPress, Zapier, OpenCart, Pabbly
Custom event tracking: Yes
Sharing & collaboration features: Yes, a few of them including Slack integration
Other conversion-driving features: Onsite popup surveys
Data privacy: Howuku is GDPR compliant
Customer support: Live chat, FAQs, knowledge base, email chat
Positive review
Negative review
Apparently Howuku hasn’t annoyed anyone enough for them to leave a negative G2 review yet.
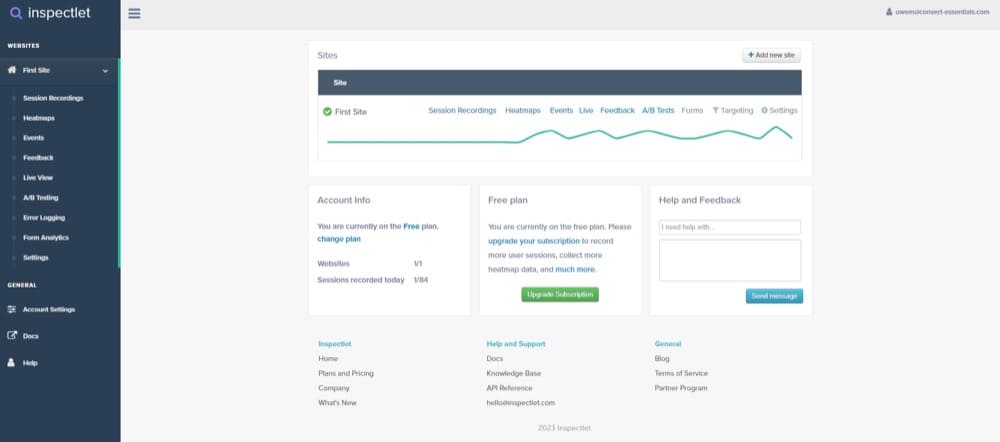
14. Inspectlet
Inspectlet is a lightweight qualitative data analysis tool that lets you gather user experience data and visualize it as heatmaps and session replay.
A/B testing, error logging, real-time analytics, and form analytics are also available.
Overall score (based on our test and analysis): 6/10
Rating: 4.2/5 from 25 reviews on G2 and 7.0/10 from 10 reviews on TrustRadius
Ideal use case: Lightweight web analytics with heatmaps, session recording, A/B testing and error logging all in one tool
Pros
- Clean, focused user interface for heatmaps, session replay, and surveys
- Easy to use
- Has dynamic heatmaps
- Session recording filter that allows quick and easy searches
Cons
- Not easy to customize analysis
- Some sessions are not captured
Pricing: Micro, the lowest priced plan, costs $39/mo
Free trial? Yes, there’s a free forever plan
Trackable devices and platforms: Desktop, tablet, and mobile phones
Effect on page loading speed: No effect
Reports & results:
- Click maps and scroll map
- Eye-tracking heatmap
- Session recordings
- Form analytics
- Feedback/surveys
Session recordings & surveys? Yes
Automatic data capture? Yes
Filters and segmentation: Yes
Rage clicks & U-turns: No
Integration with Google Analytics: Yes
Integration with A/B testing tools: Yes, Convert
Other integrations: HubSpot, Squarespace, Shopify, RequireJS
Custom event tracking: Yes
Sharing & collaboration features: You can download reports and share with your team
Other conversion-driving features: A/B testing
Data privacy: GDPR compliant
Customer support: Help chat, email support, knowledge base, and documentation
Positive review
Critical review
But it’s from 2017…
15. LiveSession
LiveSession is a user behavior analytics tool with heatmapping and session replay features. The dashboard here gives you quick access to data about how users are arriving at your site, the devices they use, their location, and a few other info.
You can easily segment this info with filters to get an understanding of how your sales funnel is performing. It has one of the best quality session recordings — it’s high def with events narrating the experience you’re watching.
It even lets you find bugs with devtools, view rage clicks, and error clicks. It’s a great tool for customer service and web development.
Overall score (based on our test and analysis): 7/10
G2 Rating: 4.6/5 from 25 reviews
Ideal use case: User research in SPA development and conversion rate optimization for SaaS and ecommerce websites.
Pros
- It works with React, Vue, Angular, and other popular frameworks — great for SPA
- Dev tools that let you track console logs and JS errors make this tool really powerful
- Records all sessions
- Spot rage clicks and error clicks
- You can set recording rules for sessions you want to track
Cons
- Heatmaps are not based on x,y position of cursor
- Narrowly fits the use case for SPA development
Pricing: Paid plans start at $65/mo
Free trial? Yes
Trackable devices and platforms: Web apps and websites
Effect on page loading speed: Unnoticeable
Reports & results:
- Funnel analysis
- Form analysis
- Clickmaps
Session recordings & surveys? Yes
Automatic data capture? Yes
Filters and segmentation: Yes
Rage clicks & U-turns: Yes
Integration with Google Analytics: Yes
Integration with A/B testing tools: Just Google Optimize
Other integrations: Slack, WordPress, Segment, Intercom, LiveChat, Survicate, etc.
Custom event tracking: Yes, you can track custom properties such as subscription plans and do form analysis
Sharing & collaboration features: You can use tags, shares, data export, and various other features to work with others in LiveSession
Data privacy: Yes. GDPR- and CCPA-compliant and excludes sensitive data.
Customer support: There’s live chat and email support. You can also learn how to use LiveSession with tutorials.
Positive review
Negative review
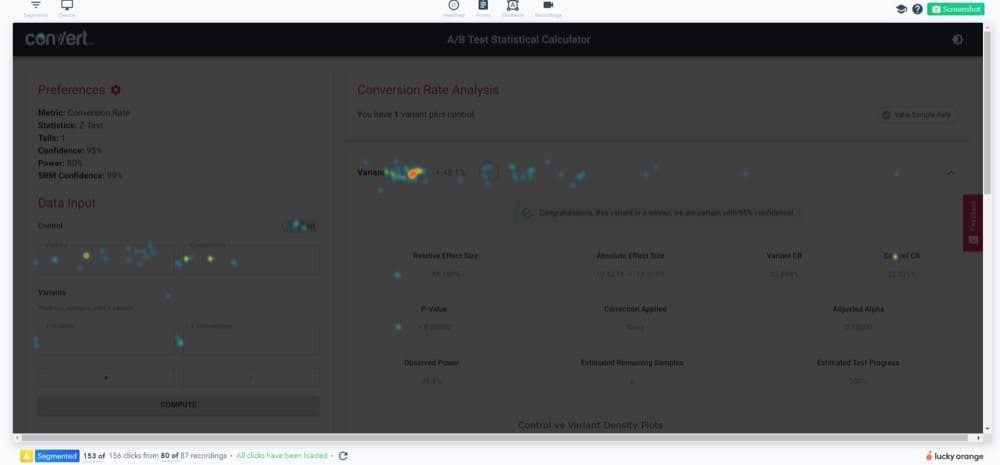
16. Lucky Orange
Lucky Orange lets you track your web pages, landing pages, and traffic sources in real time with its analytics tools. We are particularly interested in the visitor behavior analysis tools, session recordings and heatmap snapshots.
A number of conversion-friendly features are available, such as automated replies via live chat to enhance the user experience on your website.
Overall score (based on our test and analysis): 8/10
Rating: 8.5/10 on TrustRadius (19 reviews) and 4.7/5 on G2 (83 reviews)
Ideal use case: User behavior analytics for websites
Pros
- Clean, easy to use UI
- Reasonably priced considering the features
- Easy to setup heatmaps and session recordings
- Up-to-the-minute user data tracking
Cons
- Heatmaps aren’t easy to access, too many clicks to get to them
- Lucky Orange tracks pageviews, not sessions, so it’s easy to hit the limit of your pricing plan if you get lots of traffic
- Struggles with SPAs
Pricing: Starts at $14/mo when paid annually
Free trial? Yes. There’s a free plan.
Trackable devices and platforms: Desktop, mobile phone, and tablets
Effect on page loading speed: Unnoticeable
Reports & results:
- Heatmaps
- Session replay
- Dashboard insights
Session recordings & surveys? Yes, both are available on Lucky Orange
Automatic data capture? Yes
Filters and segmentation: Yes
Rage clicks & U-turns: Yes
Integration with Google Analytics: Yes
Integration with A/B testing tools: Yes, Google Optimize, Convert
Other integrations: Shopify, WordPress, HubSpot, BigCommerce, Zapier
Custom event tracking: Yes
Sharing & collaboration features: You can team members to work together and share reports
Other conversion-driving features: Live chat, form analytics, surveys, conversion funnels
Data privacy: GDPR and CCPA compliant
Customer support: You get phone support, FAQs, email support, live chat, and a knowledge base
Positive review
Critical review
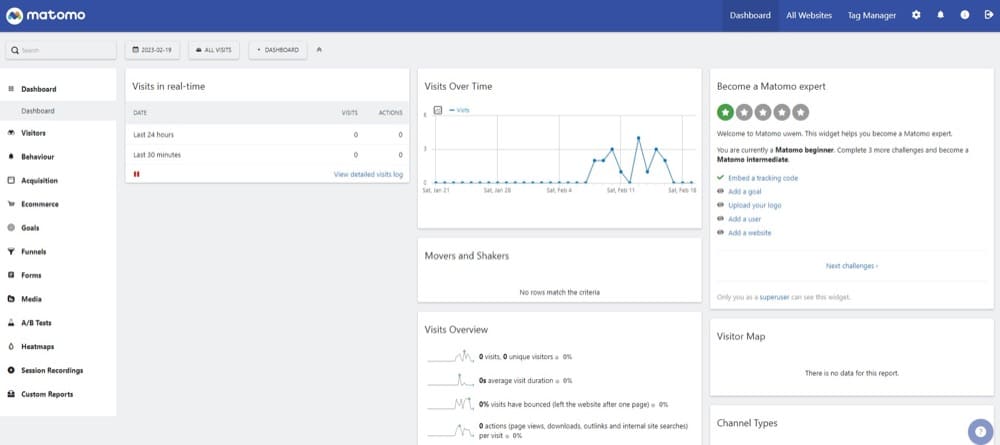
17. Matomo
Matomo Analytics, formerly known as Piwik, is an open source web analytics solution. The unique thing about Matomo is that you get 100{1652eb1ffa4184925f6a63a9c04ea6b421acb7a78117241e7d4325cdca8339fa} ownership of the tool if you host it on your server — and you keep and own all the data.
There’s also the (paid) option to host the tool on Matomo’s servers (the cloud option). And it’ll work just like any other SaaS heatmap solution.
Overall score (based on our test and analysis): 7/10
Rating: 4.2/5 on G2 (87 reviews) and 6.7/10 on TrustRadius (54 reviews)
Ideal use case: Ecommerce website analytics for websites and mobile apps
Pros
- You get access to raw data with a local database
- Works well with multiple websites in different dashboards
- Great with real-time analytics
- Has a marketplace to customize reports, functionality, and theme
Cons
- You have to manually kickstart the heatmap and session recordings
- Not the most refined UI
- Installation can be difficult
Pricing: Cloud version starts at ~$20/mo
Free trial? Yes, for 21 days on the cloud version, free forever if you host it on your servers
Trackable devices and platforms: Websites on desktop, phone, and tablet; and mobile apps
Effect on page loading speed: Noticeable
Reports & results:
- Session replays
- Web analytics
- Heatmaps (scroll maps, click maps, etc.)
- Custom reports
- Forms analytics
Session recordings & surveys? Yes to session recordings. No surveys.
Automatic data capture? Yes
Filters and segmentation: Yes
Rage clicks & U-turns: No
Integration with Google Analytics: No — this is a Google Analytics competitor
Integration with A/B testing tools: Yes, Convert
Other integrations: Integrates with CMS and Ecommerce software like WordPress and Drupal
Custom event tracking: Yes
Sharing & collaboration features: You can generate custom reports, download, and share; you can also team up with up to 30 team members
Other conversion-driving features: Funnel analytics, form analytics, and ecommerce-specific analytics tools
Data privacy: Self-hosted so you take responsibility over all your data; cloud-hosted gets user-privacy protection, 100{1652eb1ffa4184925f6a63a9c04ea6b421acb7a78117241e7d4325cdca8339fa} data ownership, GDPR compliance
Customer support: Email support
Positive review
Critical review
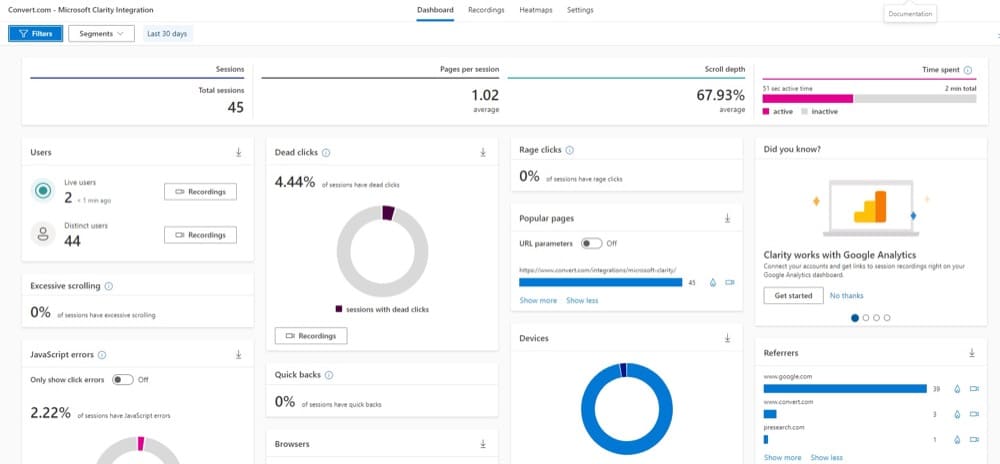
18. Microsoft Clarity
Microsoft Clarity (or ‘MS Clarity’, or just ‘Clarity’) is a free open-source-based behavior analytics tool that comes with heatmaps, session recordings, some web analytics, and automated insights.
It’s an easy tool to start using immediately (one of the easiest to use) with a solid integration with Google Analytics. If you’re interested in checking out the source code, here it is on github.
Overall score (based on our test and analysis): 8/10
G2 Rating: 4.2/5 from 25 reviews
Ideal use case: Web analytics and user behavior analysis for websites
Pros
- Totally free forever for a SaaS platform
- Smoothest integration with Google Analytics
- Tracks dynamic elements
- You can use Clarity Live extension plugin to view heatmaps on any page of your website
My #1 pick is Microsoft Clarity (after using majority of available platforms like FullStory, LuckyOrange or HotJar). I’m in love with the ability to filter heatmaps/recordings/browser events by the traffic UTM/campaign. Allowing me to understand the difference between traffic coming not just from different sources, but also campaigns (new customers vs. remarketing). This gives a lot clearer data for your goals.
Darius Kunca, Co-Founder of AdKings Agency
Cons
- No movement tracking (move maps)
- No “exclude” function in the filters
- You could experience trouble fully loading your website in the desktop view of the click maps result
Complexity of use. It’s really an advanced tool aimed at enterprise users (albeit free to use!) with a lot of options and features but this makes even me – a savvy user sometimes overwhelmed. Basically, UX is not very intuitive.
Darius Kunca
Pricing: Free forever.
Free trial? No need. It is free.
Trackable devices and platforms: Websites on mobile, tablet, and desktop devices
Effect on page loading speed: Zero effect
Reports & results:
- Click and scroll heatmaps
- Rage click and dead click insights
- 25+ filters and segmentations
Session recordings & surveys? Yes
Automatic data capture? Yes
Filters and segmentation: Yes
Rage clicks & U-turns: Yes
Integration with Google Analytics: Yes
Integration with A/B testing tools: Yes: Convert, Google Optimize, Optimizely, AB Tasty
Other integrations: Adobe Experience Platform, ClickFunnels, Shopify, Joomla, Wiz, Webflow
Custom event tracking: No
Sharing & collaboration features:
Other conversion-driving features:
Data privacy: CCPA and GDPR compliant
Customer support: FAQs, documentation, email customer support
Positive review
Critical review
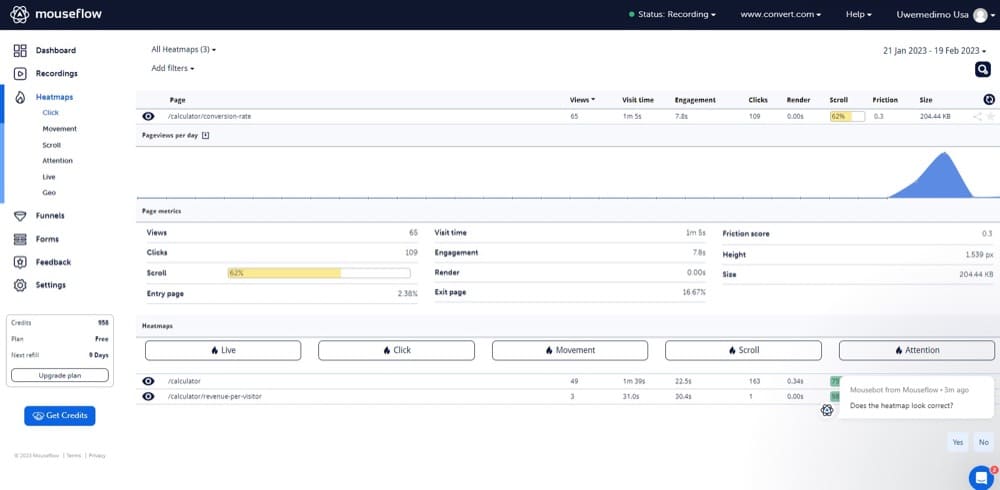
19. Mouseflow
Mouseflow’s name may hint at its capability to monitor the cursor’s travels on your website, but don’t be fooled – it’s a multifaceted tool. With session replays, conversion funnels, form analytics, interactive surveys, and six types of heatmaps, it offers comprehensive user behavior analytics.
It’s a boon for marketing teams to measure campaign performance and conduct user research on their audiences. It also helps design teams identify and remedy UX issues. Plus, product managers can use it to understand the user journey better.
Overall score (based on our test and analysis): 7.5/10
G2 Rating: 4.6/5 on G2 based on 421 reviews and 9.1 out of 10 on TrustRadius from 16 reviews
Ideal use case: Website and UX optimization for websites in various industries
Pros
- Quick and easy initial configuration
- Easy to read data
- Creates dynamic heatmaps
- Heatmaps come with a friction score that indicates users’ frustration
Cons
- Using filters and saving segments more difficult than it needs to be
- Has a bit of a learning curve for user analytics beginners
Pricing: Starts at $31/mo
Free trial? Yes. There’s a free forever plan and a 14-day trial for paid plans
Trackable devices and platforms: Desktop, mobile phone, and tablets
Effect on page loading speed: No effect
Reports & results:
- Click map, movement map, scroll map, geo heatmaps, and attention map
- Form analytics
- Web analytics
- Session replay
- Conversion funnel analytics
Session recordings & surveys? Yes
Automatic data capture? Yes
Filters and segmentation: Yes
Rage clicks & U-turns: Yes
Integration with Google Analytics: Yes
Integration with A/B testing tools: Yes, with Convert, Optimizely, Google Optimize
Other integrations: HubSpot, Intercom, Wix, WordPress
Custom event tracking: Yes, via a no-code tool and integration with Google Tag Manager
Sharing & collaboration features: You can download reports and share
Other conversion-driving features: Funnel analytics and customer feedback
Data privacy: GDPR, CCPA/CPRA, and VCDPA compliant
Customer support: Live chat support and documentation are available on all plans. But you can also get a dedicated account manager and customer success manager if you opt for the enterprise plan.
Positive review
Critical review
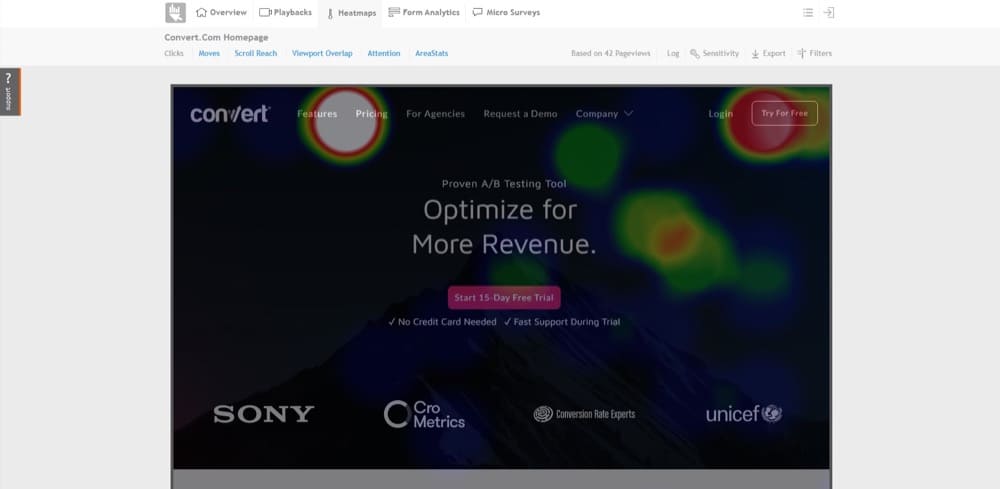
20. MouseStats
MouseStats tracks mouse clicks, movement, taps, and slides on touchscreen devices to create click, move, scroll, and attention heatmaps. You can also access element analytics to see on a granular level how users interact with images, sentences, and CTAs.
Like other tools, to install it, you only have to install an HTML code on your website and take advantage of the free trial to check it out.
MouseStats hasn’t gotten much love judging by its reviews on G2.
Overall score (based on our test and analysis): 5.5/10
G2 Rating: 1.3/5 from 2 reviews
Ideal use case: Web analytics and user experience research for websites
Pros
- Unlimited hassle-free sharing with secure URLs
- No coding skills needed to set up
- Comes with the complete heatmap package, including form analytics
- You can analyze viewport overlap in the heatmap viewer
Cons
- UI looks dated
- Session recording player takes too long to load
- May not work well with a page with lots of dynamic content
Pricing: $29/mo billed month starter price
Free trial? Yes. Scroll down the pricing page and you’ll find a free forever plan in the comparison table.
Trackable devices and platforms: Desktop, tablet, and mobile devices
Effect on page loading speed: Noticeable effect
Reports & results:
- Heatmaps
- Session replay
- AreaStats
- Form analytics
Session recordings & surveys? Yes
Automatic data capture? Yes
Filters and segmentation: No
Rage clicks & U-turns: No
Integration with Google Analytics: Yes
Integration with A/B testing tools: Yes, it integrates with Convert
Other integrations: Zendesk, WordPress, Unbounce; and you can use the API
Custom event tracking: No
Sharing & collaboration features: Reports and playbacks are shareable via a temporary URL
Other conversion-driving features: Micro-surveys
Data privacy: GDPR compliant
Customer support: Unlimited free email support
Positive review
None found.
Negative review
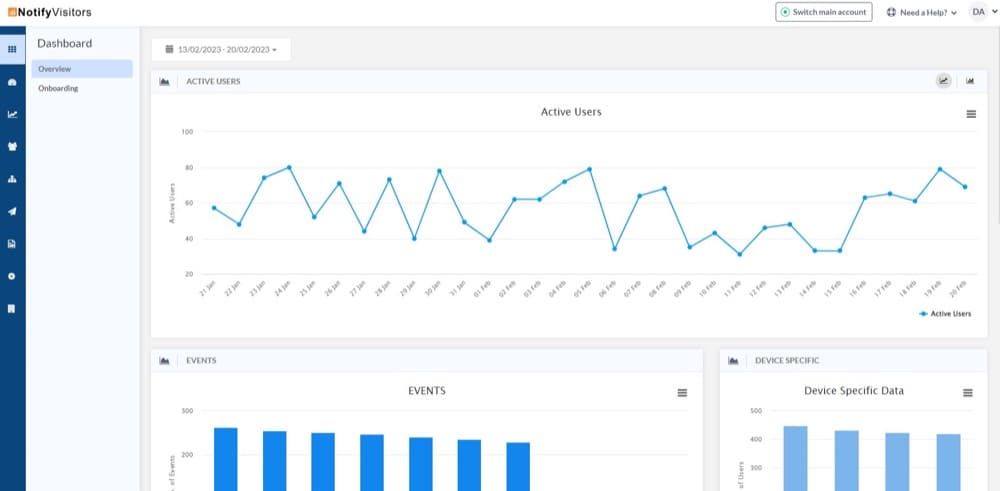
21. NotifyVisitors
NotifyVisitors is another tool that takes mouse clicks, mouse movement, scrolling, glitches, and web activities and turns them into insightful visuals. It lets you track dynamically loaded elements like pop-ups and drop-down menus which are a staple in modern day ecommerce websites.
In addition, you can record how visitors use your website and watch the replay as session recordings. Form analytics are also available.
Overall score (based on our test and analysis): 6/10
G2 Rating: 4.2/5 from 2 reviews
Ideal use case: Ecommerce website analytics and user behavior analysis
Pros
- No need for coding knowledge to get things set up
- Great for viewing multi-channel mobile attribution
Cons
- Hard to find the heatmapping feature
- Limited filter
- Has a learning curve for new users
- Third party integration gets a bit technical
Pricing: No pricing information available. You may have to speak to sales.
Free trial? Yes. But with undisclosed limits.
Trackable devices and platforms: Websites on mobile, tablet, and desktop devices; iOS and Android phone apps; and web apps
Effect on page loading speed: N/A
Reports & results:
- Heatmaps
- Session recording
- Form analytics
- Attribution tracking
Session recordings & surveys? Yes
Automatic data capture? No
Filters and segmentation: Yes
Rage clicks & U-turns: No
Integration with Google Analytics: Yes
Integration with A/B testing tools: No
Other integrations: Campaign monitor, Keap, WordPress, Mailerlite, GetResponse
Custom event tracking: Yes
Sharing & collaboration features: You can manually download reports and share with team members
Other conversion-driving features: Journey orchestration and campaign optimization
Data privacy: GDPR and other privacy regulations compliant
Customer support: Email/help desk, knowledge base, and phone support
Positive review
Negative review
None available.
22. Plerdy
With Plerdy, you can analyze web visitors’ attention and interaction for free.
This robust conversion rate optimization platform even has an SEO checker — so you can attract more organic traffic and then convert more effectively by optimizing your UX with heatmaps, session replays, feedback, and form analytics tools.
Overall score (based on our test and analysis): 6.5/10
Rating: 4.7/5 from 169 reviews on G2 and 8.1/10 from 3 reviews on TrustRadius
Ideal use case: Website analytics and user experience optimization
Pros
- It prevents popups from blocking click data
- A cleaner heatmap result will display the number of clicks on an element
- Beginner-friendly heatmap and session recording
Cons
- May not play nice when you try to use integrations
- Heatmap screenshot may cut off if the page is too heavy
- It won’t record clicks on empty spaces (a way of removing noisy data?)
Pricing: The UX & CRO package starts at $26/mo. The all-in-one plan that includes SEO, Ecommerce, Pop-Up, as well as UX & CRO packages, starts at $98/mo.
Free trial? Yes. There’s a free plan.
Trackable devices and platforms: Websites: Desktop, mobile devices, and tablet viewports
Effect on page loading speed: Unnoticeable effect
Reports & results:
- Scroll depth
- Click maps
- Event/goal tracking
- Session replay
Session recordings & surveys? Yes, both are available
Automatic data capture? Yes
Filters and segmentation: Yes
Rage clicks & U-turns: Yes
Integration with Google Analytics: No
Integration with A/B testing tools: No
Other integrations: You install the Plerdy extension on Opencart, WordPress, and Shopify; Slack
Custom event tracking: Yes
Sharing & collaboration features: You can use the Slack integration to share reports with your team
Other conversion-driving features: Popup forms, customer surveys, and conversion funnel tracking and analysis.
Data privacy: GDPR compliant
Customer support: Support tickets and FAQs
Positive review
Negative review
There was none.
23. Ptengine
Ptegine is an easy to use web analytics and heatmap platform with conversion, funnel, and campaign analysis functionality.
Tracking is available on multiple devices so webmasters and marketers can track user journey issues regardless of how they access your site.
Overall score (based on our test and analysis): 7.5/10
G2 Rating: 9 reviews gave it 4.1/5
Ideal use case: Marketing and analytics for Ecommerce and B2B service websites
Pros
- Great precision in displaying user activity with heatmaps
- Friendly and responsive customer support team
- Heatmaps are available in A/B testing mode
Cons
- You’re charged by pageviews
- Heatmap generation speed isn’t fast enough
- No session replay
Pricing: Growth plan is $49/mo and comes with a 14-day free trial
Free trial? There’s a free forever plan.
Trackable devices and platforms: PC, tablet, and phone
Effect on page loading speed: No effect
Reports & results:
- Data insights and analytics
- Heatmaps
- Realtime website analytics
- Historical heatmaps
Session recordings & surveys? Surveys, yes. No session recordings.
Automatic data capture? Yes
Filters and segmentation: Yes
Rage clicks & U-turns: No
Integration with Google Analytics: No
Integration with A/B testing tools: Yes, only on the premium plan
Other integrations: Same as above, only on the premium plan
Custom event tracking: Yes
Sharing & collaboration features: Simple sharing tools that unlocked on a paid plan
Other conversion-driving features: Conversion tracking and funnels
Data privacy: GDPR compliant
Customer support: Chat and email support only when you’re on the growth and premium plans; help documentation and community for free plans
Positive review
Critical review
24. Reactflow
Reactflow features heatmaps, funnel analytics, bugs detection, console logs, and customer feedback which you can use to reveal holes in your conversion funnel. The idea is to continuously use this qualitative data to create outstanding flows for your users.
Overall score (based on our test and analysis): 7.5/10
G2 Rating: 4.5/5 from 12 reviews
Ideal use case: Websites and SPA UX optimization
Pros
- Easy to install and use
- Fast and easy to understand UI
- You can watch the exact movements of the mouse in session replay
- Unlimited team members on all plans
- All SPA frameworks are supported
Cons
- You have to manually start the heatmap creation process
- The amount of configuration could be overwhelming
Pricing: $19.99/mo for the individual pro plan (free trial for 14 days)
Free trial? Yes, but there’s also a $0 forever plan
Trackable devices and platforms: Desktop, tablet, phone
Effect on page loading speed: No effect
Reports & results:
- Heatmaps (click, hover, scroll)
- Console logs
- Bugs tracking
- Funnel analytics
Session recordings & surveys? Yes
Automatic data capture? Yes
Filters and segmentation: No
Rage clicks & U-turns: No
Integration with Google Analytics: No
Integration with A/B testing tools: No
Other integrations: Shopify, WordPress, Joomla
Custom event tracking: No
Sharing & collaboration features: Unlimited team members on all plans mean product managers, engineers, UX designers, customer support, and digital marketers can work together on one platform.
Other conversion-driving features: Feedbacks (polls and surveys) and funnel tracking
Data privacy: GDPR compliant
Customer support: FAQs and email support
Positive review
Criticism
25. Smartlook
Smartlook is a qualitative website analytics tool that tracks user behavior on websites, mobile apps, and various web application frameworks. You can watch the video of all your users’ screens, track events, build conversion funnels, and of course, generate heatmaps based on the aggregate of mouse actions.
Overall score (based on our test and analysis): 8/10
Rating: Top Rated on TrustRadius with 8.8 out of 10 from 299 reviews and 4.6/5 from 861 reviews on G2
Ideal use case: Quantitative and qualitative analytics for websites and mobile applications
Pros
- Generous free trial plan
- Comes with a free mobile app
- Great, eye-friendly UI
- Has a bugs tracker
Cons
- Cannot tag session recordings
- The starting price costs higher than other tools
Pricing: Pro plan costs $55/mo
Free trial? Yes. There’s a free plan.
Trackable devices and platforms: Websites, mobile apps, and web apps
Effect on page loading speed: No effect
Reports & results:
- Web analytics
- Heatmaps
- Session replays
Session recordings & surveys? Yes to session recordings. For surveys, it integrates with Survicate.
Automatic data capture? Yes
Filters and segmentation: Yes
Rage clicks & U-turns: Yes
Integration with Google Analytics: Yes
Integration with A/B testing tools: Yes, Convert, Optimizely, Google Optimize
Other integrations: Slack, Intercom, Survicate, Zendesk, Zapier
Custom event tracking: Yes
Sharing & collaboration features: You can integrate with Slack to collaborate better and share recordings
Other conversion-driving features: Event tracking and funnel analysis
Data privacy: Data is encrypted; CCPA, HIPAA, and GDPR compliant and SOC 2 Type 2 certified
Customer support: Smartlook community, knowledge base, live chat, and email support available
Positive review
Negative review
26. UserExperior
UserExperior is a digital experience monitoring (DEM) tool and user experience (UX) analytics platform for web applications.
This tool caters to product managers, designers, and developers. It helps them spot UI/UX issues, troubleshoot crashes and ANRs, analyze API health, and monitor app performance.
User interaction can be filtered by taps, quick scrolling, and long presses. It also lets you test user interactions with different design and element changes.
Overall score (based on our test and analysis): 7/10
G2 Rating: 4.6 out of 5 from 27 reviews
Ideal use case: Digital customer experience analysis for ecommerce mobile apps
Pros
- Session replay comes in handy for customer support
- Easy integration with third party tools
- Provides a comprehensive view of user activity
- Supports custom events and funnel creation
Cons
- Only for apps
- The web UI could be more visually appealing
- The dashboard might be confusing to a new-timer
- Pricing is not transparent
Pricing: Custom, after your demo with sales.
Free trial? Yes. But you have to request it.
Trackable devices and platforms: Mobile apps
Effect on page loading speed: N/A
Reports & results:
- App crash and ANR
- App performance data
- Session replays
- Heatmaps
Session recordings & surveys? There’s session recording, but no surveys
Automatic data capture? Yes
Filters and segmentation: Yes
Rage clicks & U-turns: Yes
Integration with Google Analytics: No
Integration with A/B testing tools: Apptimize
Other integrations: Segment, AppsFlyer, etc.
Custom event tracking: Yes
Sharing & collaboration features: You can easily handle data export and add seats to your premium plan
Other conversion-driving features: Funnel analytics and user journey
Data privacy: GDPR compliant and SOC 2 Type 2 certified
Customer support: Dedicated account manager on the premium plan
Positive review
Negative review
None were available.
27. Visitor Analytics
Visitor Analytics is an all-around analytics platform with one of the most beginner-friendly and clutter-free experiences for anyone looking for web stats mixed with user behavior and feedback tools.
It provides a privacy-first approach to user behavior research with mature heatmapping and session recording tools. But that’s not all… You also get some conversion optimization tools.
Overall score (based on our test and analysis): 8.5/10
G2 Rating: 4.4/5 from 30 reviews
Ideal use case: Website intelligence for most types of websites
Pros
- All features are included in the free plan (just have to contend with some limits)
- Super smooth and sleek UI
- Impressive website analytics let you get familiar with your traffic
- Agency white label is available
- You always have the ability to add more external contributors and team members
Cons
- Limited customization of dashboard
- Location accuracy seems questionable
- Not all visitor sessions can be recorded
Pricing: Starts at $10.39/mo
Free trial? Yes. There’s a free forever plan.
Trackable devices and platforms: Website: desktop, tablet, and mobile phone
Effect on page loading speed: Unnoticeable effect
Reports & results:
- Web analytics
- Heatmap
- Session recording
- Polls and survey response
Session recordings & surveys? Yes
Automatic data capture? Yes
Filters and segmentation: No
Rage clicks & U-turns: No
Integration with Google Analytics: No, this is a Google Analytics competitor
Integration with A/B testing tools: No
Other integrations: WordPress, Bitrix24, Drupal, BigCommerce, Shopify, Squarespace and more
Custom event tracking: Yes
Sharing & collaboration features: Great for teaming up with external contributors and internal team members. You can add notes and share URLs of session recordings.
Other conversion-driving features: Competition analysis, conversion funnels, and campaign analysis
Data privacy: CCPA, COPPA, GDPR, ePrivacy, and several other privacy regulations compliant
Customer support: Documentation, FAQs, live chat, and email support
Positive review
Negative review
None with reference to current issues.
28. VWO Insights
VWO Insights is part of the suite of digital experience optimization tools offered by the vendor. It gives you heatmapping, session recordings, funnels, and form analytics features.
Overall score (based on our test and analysis): 7/10
G2 Rating: 4.2/5 from 48 reviews
Ideal use case: Enterprise-level website insights and user experience optimization
Pros
- Pro plans are pricey if you only want the heatmap and session recording feature
- You get all the tutorials and support you need
- Requires minimal upkeep to maintain data update and collection
- Really easy to configure interaction tracking
Cons
- Heatmaps could be a bit laggy
- Might not work great with SPAs
- Expensive plans that also needs to be paid annually
Pricing: Growth plan starts at $181/mo billed annually (for 10k monthly tracked users, that’s the lowest)
Free trial? There’s a free forever plan
Trackable devices and platforms: Websites on desktop, mobile, and tablet devices
Effect on page loading speed: No effect
Reports & results:
- Heatmap visualization (click area, click map, scroll map)
- Session replay
- Form analytics
- Survey responses
Session recordings & surveys? Yes
Automatic data capture? Yes
Filters and segmentation: Yes
Rage clicks & U-turns: No
Integration with Google Analytics: Yes
Integration with A/B testing tools: VWO has its own A/B testing tool
Other integrations: Adobe Analytics, BigCommerce, Contentsquare, Slack
Custom event tracking: Yes
Sharing & collaboration features: Easy way to email reports to teammates; you can also integration with Slack
Other conversion-driving features: Form analytics, goal tracking, conversion funnel report
Data privacy: They comply with the major privacy laws and regulations but they store some visitor behavior data on their servers.
Customer support: Phone support is available
Positive review
Negative review
29. WatchThemLive
WatchThemLive is a behavior analytics tool that includes heatmaps in its free plan. You can track clicks, scrolls, and mouse movements, and on touchscreen devices, track taps and slides.
The price is freelancer and agency-friendly, and it matches the features you get. However, the plans do not support more than two websites.
Overall score (based on our test and analysis): 6/10
G2 Rating: 5/5 but that’s just from 1 review
Ideal use case: Heatmaps and session recording for web products
Pros
- Great customer support and live chat
- Has extensive filtering options
- Easy to grasp and precise analytics dashboard
- Provides conclusive report through the teams feature
Cons
- No scroll heatmaps
- No easy-to-share link for session recordings
Pricing: Starts at $29/mo (billed annually)
Free trial? There’s a free forever plan
Trackable devices and platforms: Websites on PC, tablet, and phones
Effect on page loading speed: No effect
Reports & results:
- Session replay
- Click maps
- Console recording
- Web analytics
Session recordings & surveys? No surveys, but it offers session recordings.
Automatic data capture? Yes
Filters and segmentation: Yes
Rage clicks & U-turns: Yes
Integration with Google Analytics: No
Integration with A/B testing tools: No
Other integrations: MyURLs.bio
Custom event tracking: Yes
Sharing & collaboration features: Helps you generate results for team collaboration
Other conversion-driving features: Page optimization, video testimonials, conversion and goal tracking, and visual live chat
Data privacy: GDPR compliant
Customer support: FAQs, how-to guides, and live chat
Positive review
30. Yandex.Metrica
Yandex.Metrica is a suite of web analytics tools for researching and understanding user experience on your website. The amazing thing about it is that it’s totally free, forever.
This suite of free marketing analytics also gives you our favorite features: session recording and heatmapping. You can use the data visualizations and session replays to find UX issues and unravel ways to improve the experience for people who use your website.
Overall score (based on our test and analysis): 5.5/10
G2 Rating: 4.2/5 from 17 reviews
Ideal use case: Websites on desktop, tablet, and mobile phones
Pros
- All-in-one analytics platform for free
- Easy installation and navigation
- Extensive web analytics and optimization features for a free tool
Cons
- Need to translate Russian to use the tool
- Yandex is unclear about why this platform is free
- There’s a learning curve when it’s your first time
- There may be differences between Google Analytics data and what you get with this
Pricing: All free with no limits.
Free trial? It’s free.
Trackable devices and platforms: Websites on various devices
Effect on page loading speed: Noticeable effect
Reports & results:
- Click maps and link maps
- Session replay
- Survey responses
Session recordings & surveys? Yes
Automatic data capture? Yes
Filters and segmentation: Yes
Rage clicks & U-turns: No
Integration with Google Analytics: No
Integration with A/B testing tools: Yes, Convert and Omniconvert
Other integrations: Segment, Venue, Google Data Studio, Joomla, Magento, Django, etc.
Custom event tracking: Yes
Sharing & collaboration features: You can create reports, download and share with team members
Other conversion-driving features: Funnel analytics, ecommerce reporting, and custom events tracking
Data privacy: GDPR compliant
Customer support: Email support and documentation
Positive review
Negative review
31. Zoho PageSense
Zoho PageSense (or just PageSense) is Zoho’s conversion optimization and personalization platform designed to help you measure website metrics, monitor your web visitors’ behavior, and create personalized experiences for higher conversion rates.
Overall score (based on our test and analysis): 6.5/10
G2 Rating: 4.2/5 from 25 reviews
Ideal use case: Digital marketing and optimization for small and mid-sized businesses in various industries
Pros
- Has great data segmentation function
- Great starting price
- Solid heatmap and session recording feature
- Easy to install and configure
Cons
- You have to manually set up the heatmap data collection process
- Takes repeated refreshing to verify proper installation of the tracking code
- The UI could look better
- Support might not be the best (maybe because of the low cost)
Pricing: Starts at $12/mo
Free trial? Yes, for 15 days.
Trackable devices and platforms: Websites on various viewports
Effect on page loading speed: No effect
Reports & results:
- Heatmaps
- Form analytics
- Session replays
Session recordings & surveys? There are polls and session recordings.
Automatic data capture? Yes
Filters and segmentation: No
Rage clicks & U-turns: No
Integration with Google Analytics: Yes
Integration with A/B testing tools: No, they offer A/B testing features
Other integrations: Intercom, Google Ads, Kissmetrics, Mixpanel
Custom event tracking: No
Sharing & collaboration features: You can add team members to collaborate on projects together
Other conversion-driving features: Personalization and funnel analytics
Data privacy: Zoho takes privacy seriously and is GDPR and HIPAA compliant
Customer support: Community, user guide, FAQ, video tutorials, phone support, and email support.
Positive review
Negative review
None addressing current issues.
Other Heatmap Tools
Now, for the tools that aren’t heatmap tools in the context we’re using here — which is a tool that aggregates interaction data such as mouse movement and clicks to create a heatmap of actual user behavior on your website.
1. Attention Insight
Attention Insight generates heatmaps using algorithms and 70,000 eye-tracking images, instead of monitoring what actual users do on your website. Therefore, it is an AI-generated heatmap tool.
It gives you an idea of what actual mouse tracking software could create but does it instantly, so you’ll immediately know the most and least attention-grabbing parts of your design.
Overall score (based on our test and analysis): 6/10 (Because it produces AI heatmaps, not heatmaps from real-world data, so it does a good job at what it was built to do.)
G2 Rating: 4.8/5 from 29 reviews
Ideal use case: Ecommerce and SaaS website design optimization
Pros
- Heatmaps for websites with no traffic in less than 60 seconds
- Enables the comparison of two designs
- Integrates with Adobe XD, Photoshop, Figma, Zapier, and more
- Decent collaboration features
- Easy to use by someone without a strong technical background
- Most likely the most affordable tool in this category
Cons
- Heatmaps are not based on actual user data but on algorithms, so you can’t use it to inform your optimization decisions
Pricing: Starts at $23/mo for the solo plan
Free trial? Yes. For 7 days.
Supported devices and platforms: Works best with websites, but you can analyze snapshots of just about any design such as apps dashboard, ad banners, product packaging, etc.
Integrations: Chrome extension available, Adobe XD, Photoshop, Zapier, Figma, Sketch
Sharing & collaboration features: You can generate reports, download analyses, and add additional user seats on team and custom plans.
Other conversion-driving features: Besides the design recommendations, none.
Data privacy: Data (snapshots and analyses) are stored for up to 12 months, besides that there’s nothing that risks your data or customer data.
Customer support: Live chat support, training, live onboarding, dedicated account manager, knowledge base, and tutorials are available. Depends on the subscription plan.
Positive review
A rare critical review
2. Expoze.io
Expoze.io uses AI, computer vision, and eye tracking data to predict areas of the least and most attention in your designs. This is represented by a heatmap that’s generated in seconds.
This works with just about any design. You only have to take a screenshot of your design and upload it. When it’s done generating your design, you can download, share it, and pull some insights from it.
Overall score (based on our test and analysis): 5/10 (Because it doesn’t create heatmaps in the conventional sense)
G2 Rating: 5/5 from 1 review on G2
Ideal use case: Design of any marketing asset
Pros
- Quick heatmaps to analyze attention
- Supports collaboration with additional users without additional costs on the $200 plan
- Super easy to use, no tech knowledge required
- They don’t add their logo to the generated heatmap
Cons
- It’s an AI generated heatmap, not aggregated data from actual user experience
- The free plan is too limited
Pricing: Starts at ~$21 per month (19.99 EUR)
Free trial? Yes. There’s a free plan to analyze 5 images and 14 days trial on the pro plan for 100 more images.
Supported devices and platforms: Any design — even scanned copies of magazines
Integrations: Figma and Chrome.
Customer support: Email chat, live chat, and knowledge base
Positive review
Negative review
Not a lot of reviews of Expoze.io were available.
3. EyeQuant
EyeQuant says on their website: “Behavioral analytics show what has happened. EyeQuant Experience shows you what will happen.”
So, that’s where it shines. By combining artificial intelligence and neuroscience, it predicts how visual elements in your design will engage users.
Overall score: Based on our criteria here, which are heatmap and session replay capabilities, 4/10
G2 Rating: 4.8/5 based on 17 reviews
Ideal use case: Data-driven attention prediction for design validation
Pros
- Provides features such as clarity score, visual saliency, perception map, regions of interest, and attention map
- Plugs into Figma
- Your data is stored for up to 1 year on the entry plan
- You can generate heatmaps quickly with up to 90{1652eb1ffa4184925f6a63a9c04ea6b421acb7a78117241e7d4325cdca8339fa} accuracy when compared with physical studies (as stated on their website)
Cons
- It predicts attention, it doesn’t present actual attention data
Pricing: Starts at ~$300/mo
Supported devices and platforms: Most website-based designs
Free trial? No
Integrations: Figma
Customer support: Help documentation and email support
Positive review
Critical review
4. Feng-GUI
Feng-GUI is an AI-powered neuromarketing tool that creates predictive heatmaps. Like others in this category, you upload a picture of your design and Feng-GUI will return an AI-generated attention heatmap overlaid on the design.
Overall score: 5/10 (for AI-generated attention heatmaps)
G2 Rating: 4.5/5 from 1 review
Ideal use case: Attention prediction during the design phase of marketing assets
Pros
- Generates heatmaps in seconds to minutes
- Also generates gaze plot and AOIs reports
- Add your custom watermark
- One of the more affordable tools in this category
Cons
Pricing: Starts at $99/mo on the basic plan
Supported devices and platforms: Digital marketing designs
Free trial? No
Integrations: You can use APIs
Customer support: There are video guides in a YouTube playlist on their channel, FAQs on the website, and email support with a response within 2 business days.
A review
5. Glassbox
Glassbox is a digital insights platform that helps teams track everything a customer does, such as what they click on and their journey through the sales funnel. It also lets you examine your website design and digital products — so, it’s built for marketers, product designers, and engineering teams.
With smart bug detection, technical events monitoring, and digital analytics, it’s a well-rounded tool for SaaS marketing, engineering, and product management.
Overall score (based on our test and analysis): 8/10
Rating: 8.7 out of 10 (46 reviews) on TrustRadius and 4.8/5 on G2 (376 reviews)
Ideal use case: Enterprise-grade digital customer experience intelligence for software products across various industries
Pros
- Huge, powerful, and well-rounded tool (if you’re looking beyond just heatmaps)
- Lots of useful integrations
- Mature product with tons of features
Cons
- Pricing is not transparent
Pricing: You have to request pricing
Supported devices and platforms: Websites and web apps on various devices
Free trial? No. Only demos.
Integrations: Google Analytics, Adobe Analytics, Dynatrace, Tealium, Qualtrics, Jira, Slack, Optimizely, AB Tasty, and more.
Customer support: There’s a support portal with tickets and a knowledge center
Positive review
Critical review
6. Heatmap.js
Heatmap.js is the first level of visualizing mouse movement and clicks on your website. What this means is that it isn’t an out-of-the-box solution. You’ll have to develop your own heatmap tool on top of heatmap.js’s code available on GitHub.
If you want to build a heatmap tool business, this can expedite the process for you. But if you want to generate heatmaps now, then even heatmap.js will point you to another tool.
Overall score: 1/10
Rating: N/A
Ideal use case: Custom heatmap tool development
Pros
- Great starting point for a heatmap developer
Cons
- Not easy to implement if you don’t have developer-level skills, the tool even directs you to Hotjar with a slide-in popup
- No insights come with this tool; It’s just an open source heatmap JS library
Pricing: It’s free.
Supported devices and platforms: Depends on what you create from it
Free trial? Not applicable in this case.
Integrations: Also, depends on what you do
Customer support: You can contact the OG developer via email (available on the GitHub repo)
A review
Neither G2 nor TrustRadius list this.
7. Quantum Metric
Quantum Metric is a customer experience visualization tool used by big names like Lenovo and Western Union. It features session replay and heatmapping capabilities.
As with most heatmapping tools, it provides scroll maps, click maps, interaction heatmaps, and reach maps based on customer usage data. It also supports advanced and dynamic heatmapping.
That means it can recognize when elements change position or slide into view (pop-ups, for example) and record those in the results.
Overall score: 8/10
G2 Rating: 4.7/5 stars (161 reviews) and 8.9/10 (53 reviews)
Ideal use case: Qualitative and quantitative digital customer research and analysis
Pros
- Has machine learning features to detect customer frustration
- Generates interaction heatmaps quickly
- Matches qualitative data with quantitative data; web analytics with UX analysis
Cons
- Heatmaps are only one of its many features, so it’s quite huge and could be overwhelming if you’re only looking for heatmaps and session replays
- No free trial, no pricing — only demo and custom pricing
Pricing: You’ll have to contact sales
Supported devices and platforms: Websites and mobile apps
Free trial? No. Only demos.
Integrations: Google Analytics, Salesforce, Servicenow, Optimizely, Qualtrics, Usertesting, etc.
Customer support: Live chat, knowledge base, online university, partner portal, and customer support portal.
Positive review
Negative review
8. RealEye
RealEye is a powerful software that watches the pupils of a user through their webcam and uses AI to detect where they’re looking (also known as gaze point). That’s how it creates a gaze plot, which is like a heatmap but for eye tracking.
All you have to do is send the URL of your design (ad creatives, website, apps, etc.) and RealEye presents it to their testers. In the end, you get heatmaps as PNG files, video recordings as MP4s, and CSV files with other data.
Overall score: 7/10
G2 Rating: No reviews
Ideal use case: User research with webcam eye-tracking
Pros
- Actual eye-tracking data and gaze plots
- Expensive for heatmaps but not so expensive for real eye-tracking
- Provides a lot of data and attention insights
Cons
- May not be your target audience but a group of pre-selected testers
- The experience for the tester might not be 100{1652eb1ffa4184925f6a63a9c04ea6b421acb7a78117241e7d4325cdca8339fa} organic
- Doesn’t work on mobile devices
Pricing: Starts at $249/mo
Supported devices and platforms: Website UX testing and advertisement
Free trial? Yes, for 7 days
Integrations: Qualtrics, Survey Monkey, Cint, Prolific, Google Forms
Customer support: Live chat and knowledge base
Positive review
None available
Negative review
None available
9. UXCam
UXCam is the biggest name for mobile apps heatmaps. They’ve built a comprehensive tool to help you watch your users interact with your app.
It even goes beyond that to give you a deep understanding of user experience and user journeys within your app.
Overall score: 9/10
Rating: 4.7/5 on G2 based on 134 reviews, 9.3/10 from 3 reviews on TrustRadius
Ideal use case: User experience analysis on mobile apps
Pros
- All-in-one metrics and recording capture
- Easy to install
- Provides great business insights
- Get heatmaps, drop off analysis, and user flows
- Great customer service
Cons
- Filters may be difficult to use for some
- Custom events may require a backend developer to setup
- No transparency in pricing
- Only for mobile apps
Pricing: Custom
Supported devices and platforms: Mobile apps, iOS and Android
Free trial? Yes. There’s a free pricing tier. Other plans have a 14-day trial offer.
Integrations: Zendesk, Intercom, Firebase, Segment, etc.
Customer support: Developer docs, learning center, and you can contact support via a web form
Positive review
Negative review
Conclusion
So there you have it. You now know what heatmaps are, their types, and how to read them.
Although they aren’t everything there is in user research, they can help you analyze the strengths and weaknesses of your websites and apps. They can support you in making informed decisions about optimizing for better user experience and conversion rates.
Using this in-depth comparison, you can choose the best heatmapping tool that fits your specific needs and use case.


